RavenQuant ATH Scanner
RavenQuant ATH Scanner helps you analyze S&P 500 stocks with one clear, repeatable workflow: build/load a workbook of historical constituents and prices, detect tickers that meet a strict multi-month new-ATH pattern, and backtest monthly rotation results against SPY.
It lets you:
- run Mode 1 to scan one buy month and see which tickers matched the ATH streak rule (this mode is limited to most recent 6 months)
- run Mode 2 to backtest that rule over a selected buy-month range with multiple runs, compare strategy equity, trade log, taxes, and returns versus SPY,
You can tune global assumptions (ATH step %, streak months, tax rate) and immediately see how results change.
In short: it is a point-in-time S&P 500 ATH signal scanner + backtesting tool, built to test this exact strategy logic transparently.
Price range: 69.00 $ through 89.00 $
Previous lowest price was 69.00 $.
ATH Scanner
A practical S&P 500 ATH signal scanner and backtesting workspace. Build or load a workbook, detect multi-month ATH streak setups, and benchmark monthly rotation results against SPY.
Clear settings and repeatable rules.
Logs, equity curves, and summaries.
Build, scan, compare, adjust.
Why it matters
Take full control of your strategy process
ATH Scanner gives you a transparent workflow with no black box: consistent data, strict signal logic, and outputs you can review before risking capital.
No vague “AI signals”. No hidden logic. Just measurable rules, configurable parameters, and outputs you can inspect.
Positioning
Built for structured momentum research
Use it to test ideas faster, validate setup logic, and compare results against SPY in a more disciplined workflow.
Core functions
What you can actually do
Start from a ready workbook or build historical S&P 500 and pricing data inside the app.
Run one selected buy month through configurable ATH streak logic and inspect which tickers qualified.
Test selected buy-month ranges, then review equity, returns, tax assumptions, and comparison vs SPY.
Change ATH step %, streak months, and tax rate, then rerun and compare outcomes immediately.
Screens
See the workflow in context
Editions
Lite vs Full
| Feature | Lite | Full |
|---|---|---|
| Autobuild snapshot of S&P 500 constituents | Included | Included |
| Load ready workbook | Included | Included |
| Config settings | Included | Included |
| Mode 1 scan (one buy month) | Included | Included |
| Mode 2 backtest vs SPY | Not included | Included |
| Trade / equity outputs | Mode 1 only | Mode 1 + Mode 2 outputs |
Lite
Best for signal-only workflow
- Autobuild snapshot included
- Load ready workbook
- Config settings included
- Mode 1 scan included
- No Mode 2 backtest vs SPY
- Outputs limited to Mode 1
Full
Best for scan + backtest workflow
- Autobuild snapshot included
- Load ready workbook
- Config settings included
- Mode 1 scan included
- Mode 2 backtest vs SPY included
- Mode 1 + Mode 2 outputs
Turn strategy ideas into measurable results
Buy ATH Scanner and start testing momentum rules with a clearer, faster, and more transparent workflow.
Workflow
How it works
Build or load data
Start from an existing workbook or generate a compatible one in-app.
Set the logic
Adjust ATH step, streak length, and tax settings to match your research idea.
Run and compare
Scan signals or backtest month ranges, then compare performance against SPY.
FAQ
Frequently asked questions
1) What is ATH Scanner?
ATH Scanner is an app for scanning S&P 500 ATH-based momentum setups and testing them with historical backtests.
2) Who is this product for?
It is for people who want a structured, data-based way to test strategy ideas before using real capital.
3) What can I do in Mode 1?
Mode 1 scans one selected buy month and shows which tickers matched the ATH rule.
4) What can I do in Mode 2?
Mode 2 backtests the strategy over a selected buy-month range and compares results vs SPY.
5) What is the difference between Lite and Full?
Lite includes Mode 1 and shows Mode 2 as locked. Full unlocks both Mode 1 and Mode 2.
6) What settings can I customize?
You can adjust ATH step (%), streak length (months), and tax rate.
7) Do I need programming knowledge to use it?
No. The app is designed for practical use with a guided workflow in the interface.
8) Can I upload my own workbook?
Yes, but it must follow ATH Scanner’s required structure. Best practice: first generate a short workbook in the app and use it as your template.
9) Does the app include data automatically?
You can build data inside the app (Wikipedia + Yahoo Finance) or load an existing workbook.
10) Do I need internet access?
Internet is needed when building/updating data from external sources. Loaded workbooks can be reused later.
11) Why can results change over time?
External sources may update historical data, and your selected parameters also affect outcomes.
12) Is this financial advice?
No. ATH Scanner is a research and backtesting tool, not personalized investment advice.
13) Is my strategy guaranteed to work in the future?
No. Backtests show historical behavior only; future market conditions can differ.
14) What output do I get after running analysis?
You get clear tables/charts, run summaries, and trade-level logs (depending on mode/edition).
15) How quickly can I start?
Usually in a few minutes: build or load workbook, set parameters, choose mode, and run.
ATH Scanner — practical S&P 500 signal scanning and backtesting.
Get the productDo you need help?
Latest posts
-
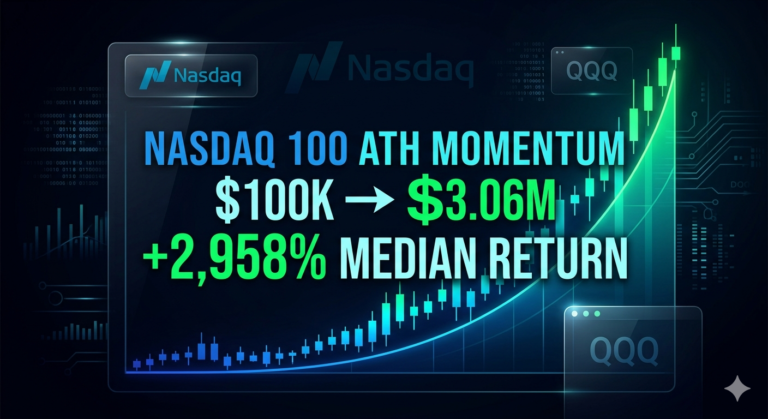
Nasdaq 100 Momentum Strategy: Turned $100k into $3M in 26 Years
Momentum Strategy Nasdaq 100 March 2000 – January 2026 · 20 runs · $100,000 start In a previous analysis the ATH-staircase momentum strategy returned a median of +1,269% on the S&P 500 over 25 years. Same entry filter, same 2-month…
-
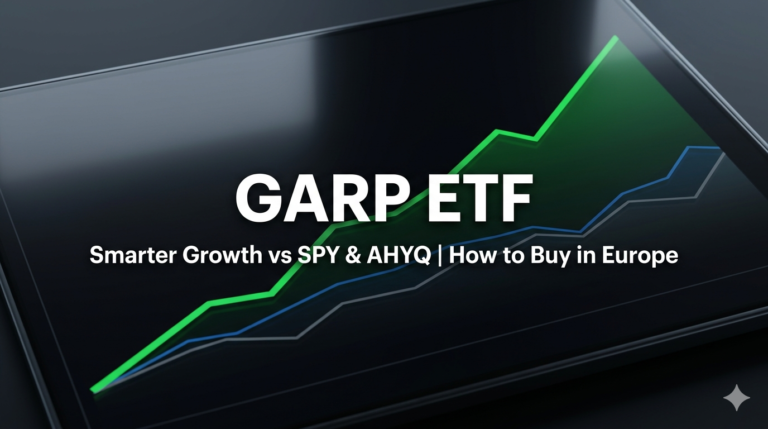
GARP ETF: Why It Works, How It Compares to SPY and AHYQ, and How to Buy It in Europe
ETF Research Factor investing GARP · SPY · AHYQ · launched 15 Jun 2020 · May 2026 Most long-term investors eventually land on the same compromise: buy a broad index fund and accept whatever the market gives you — including…
-