S&P 500 Index Addition Strategy: Does Buying New Members Beat the Index?
The S&P 500 index addition strategy is one of the most repeated ideas in systematic trading: when a stock joins the index, passive funds must buy shares, creating a predictable flow that traders try to front-run. Every time the S&P 500 committee announces new index members, this narrative resurfaces. But does a mechanical S&P 500 index addition strategy actually produce a durable edge — and does shorting new members work any better?
We backtested the full history of S&P 500 additions from March 2000 through January 2026. For each new constituent, we simulated entering on the effective addition date and holding for 1, 2, 3, 4, 5, or 6 months — in both directions, long and short. Capital compounds trade-by-trade with a 19% tax on each closed batch, benchmarked against a buy-and-hold position in SPY over the same window.
Best long total return
+48.7%
3-month hold (88 trades)
Best short total return
+42.8%
1-month hold (161 trades)
SPY benchmark
+563.7%
Same period, same start
Worst variant
−114.8%
2-month short (ruined account)
The Index Inclusion Effect: Theory vs. Reality
The idea that index additions create trading opportunities is one of the oldest documented anomalies in finance. In a landmark 1986 paper, Andrei Shleifer showed that when a stock enters a major index, passive and benchmark-aware funds must buy shares regardless of price — creating temporary demand that can push the stock above fair value. Harris and Gurel (1986) documented abnormal returns around S&P 500 inclusions averaging roughly 3–4% in the days surrounding the announcement.
The mechanism is intuitive. When a company joins the S&P 500, index funds tracking the benchmark receive inflows proportional to the stock’s new weight. Mutual funds, ETFs, and pension funds that benchmark against the S&P 500 must buy the shares — often on a known effective date. This creates a predictable flow of passive buying that, in theory, front-runners can exploit.
But the academic literature also highlights important caveats that matter for any real strategy:
1. The run-up happens early
Much of the inclusion premium is priced in between announcement and effective date. By the time a stock officially joins, the easy money may already be gone.
2. Additions are often momentum stocks
Companies typically enter the index after strong performance. You are often buying what has already worked — not a hidden gem.
3. The effect has decayed
As more capital has indexed and more traders arbed the anomaly, the magnitude of post-inclusion returns has compressed since the 1980s and 1990s.
Our backtest tests the practical question a systematic investor would actually face: if I mechanically buy (or short) every new S&P 500 addition on the effective date and hold for a fixed period, do I beat the index over a full market cycle including the dot-com bust, GFC, COVID, and the 2022 rate shock?
Backtest Methodology for the S&P 500 Index Addition Strategy
We compiled the historical list of S&P 500 index additions from March 2000 through January 2026. For each addition event with available price data, we simulated a portfolio that enters on the effective date and exits after the chosen holding period. When multiple additions overlap, capital is split same-day across open positions (locked-capital portfolio mode). This is the full ruleset used to evaluate whether an S&P 500 index addition strategy can beat passive indexing over a complete market cycle.
| Parameter | Value |
|---|---|
| Universe | S&P 500 index additions (effective dates) |
| Period | March 2000 – January 2026 |
| Starting capital | $100,000 |
| Entry | Close on effective addition date |
| Exit | Close after 1, 2, 3, 4, 5, or 6 calendar months |
| Directions tested | Long and short (12 configurations total) |
| Tax | 19% on net gain/loss per closed batch |
| Capital model | Compounding portfolio with locked capital per open trade |
| Benchmark | SPY buy-and-hold from first trade date |
| Price source | Yahoo Finance (split and dividend adjusted) |
| Events skipped (data) | 72–83 per configuration (see note below) |
| Raw addition events | 235 in sample period (constant across all configurations) |
Important limitation — read the event counts carefully: The sample contains 235 S&P 500 addition events from March 2000 through January 2026. Of those, 72–83 were skipped in each backtest configuration because we could not build a valid entry-and-exit pair (missing adjusted prices, ticker changes, mergers, delistings, or — for longer holds — no trading day far enough out to define the exit). That is roughly 31–46% of the raw list, depending on holding period (72 skipped at 1 month ≈ 31%; 83 skipped at 6 months ≈ 46%).
The Trades column in the results table is not “235 minus skipped.” It is the number of positions actually opened in the compounding portfolio simulation. That count falls as the holding period lengthens for two reasons: (1) more events fail the exit-date requirement at screening, and (2) overlapping positions lock capital, so some screened-in signals are never funded. Example: at 1 month, 163 trades were executed from 163 screened-in candidates (72 others skipped at screening; 235 raw total). At 3 months, only 88 trades were executed even though 158 candidates passed screening (77 skipped; 235 raw total) — 70 valid signals were not funded because capital was locked in other open positions.
| Hold (long) | Raw events | Skipped (data) | Screened in | Trades executed | Unfunded (capital lock) |
|---|---|---|---|---|---|
| 1 month | 235 | 72 | 163 | 163 | 0 |
| 2 months | 235 | 73 | 162 | 126 | 36 |
| 3 months | 235 | 77 | 158 | 88 | 70 |
| 4 months | 235 | 78 | 157 | 65 | 92 |
| 5 months | 235 | 78 | 157 | 71 | 86 |
| 6 months | 235 | 83 | 152 | 47 | 105 |
Screened in = raw − skipped. Trades executed ≤ screened in; the gap is unfunded signals when capital was locked in other open positions.
This introduces survivorship and data-availability bias. Results describe what was tradable in our price database, not a guaranteed replicable history of every real-world inclusion.
Results: All Twelve Configurations
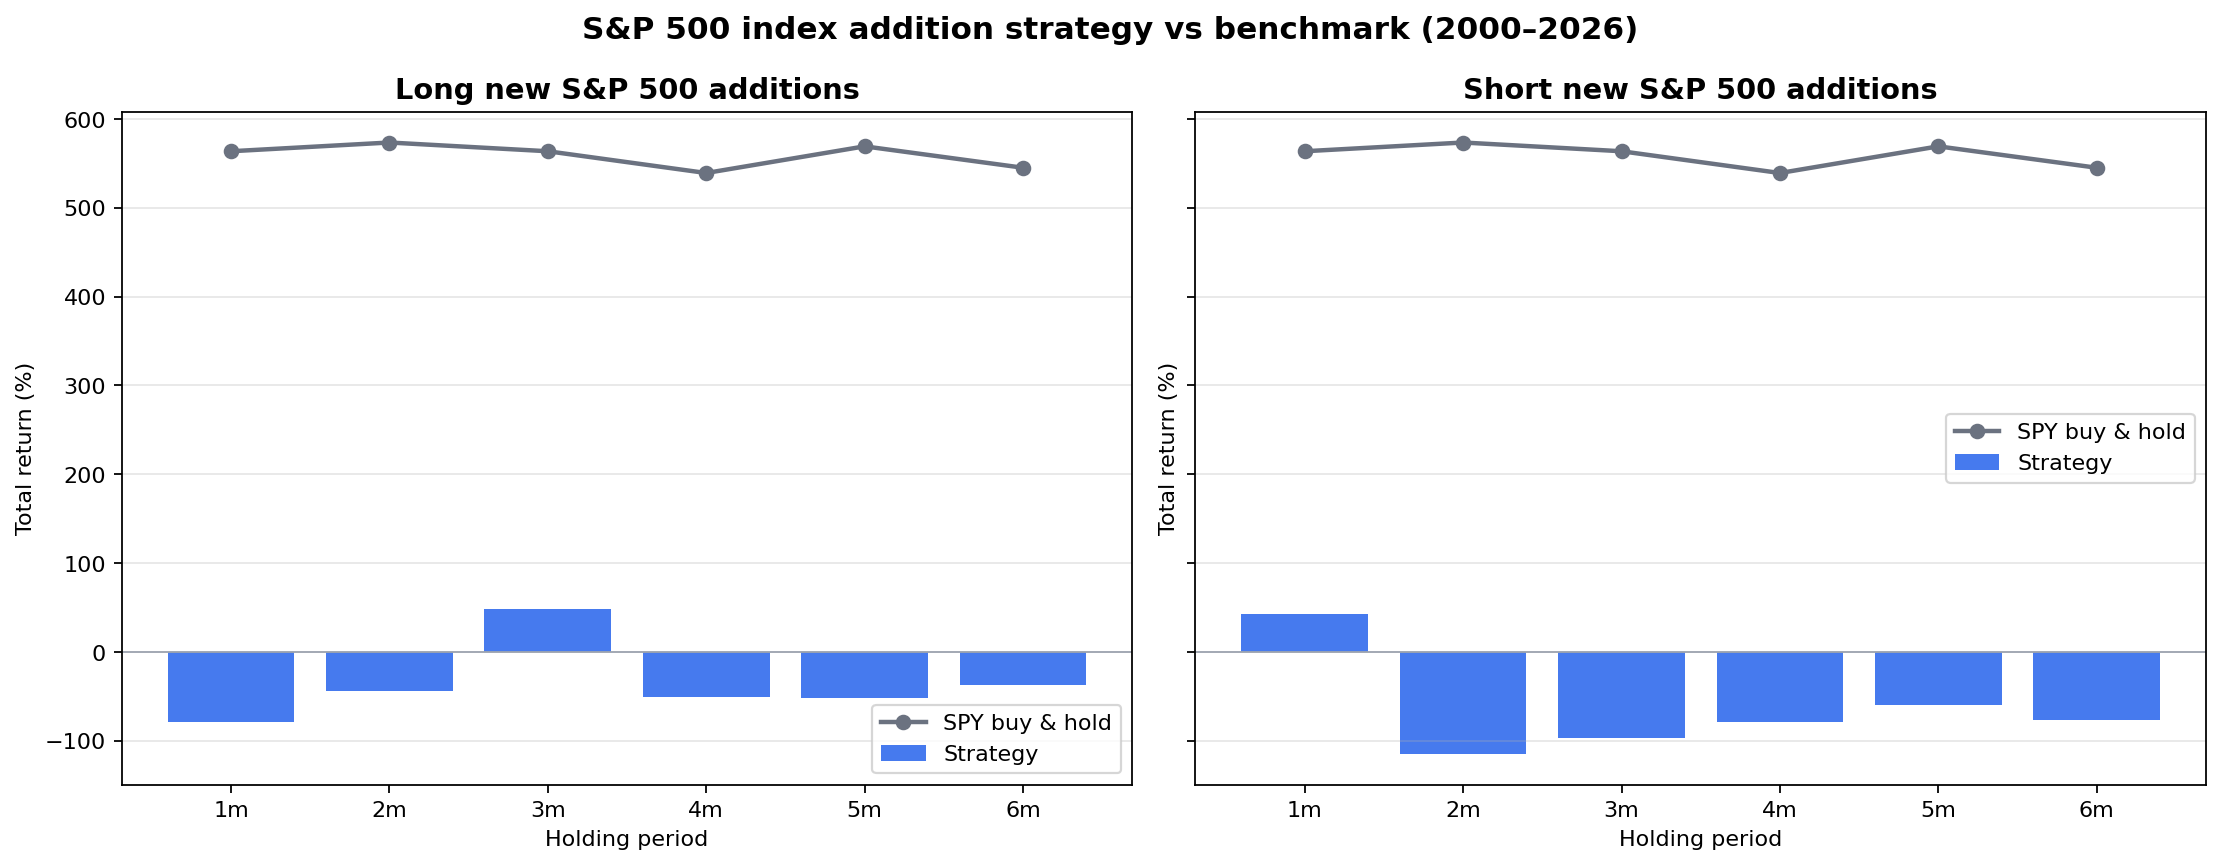
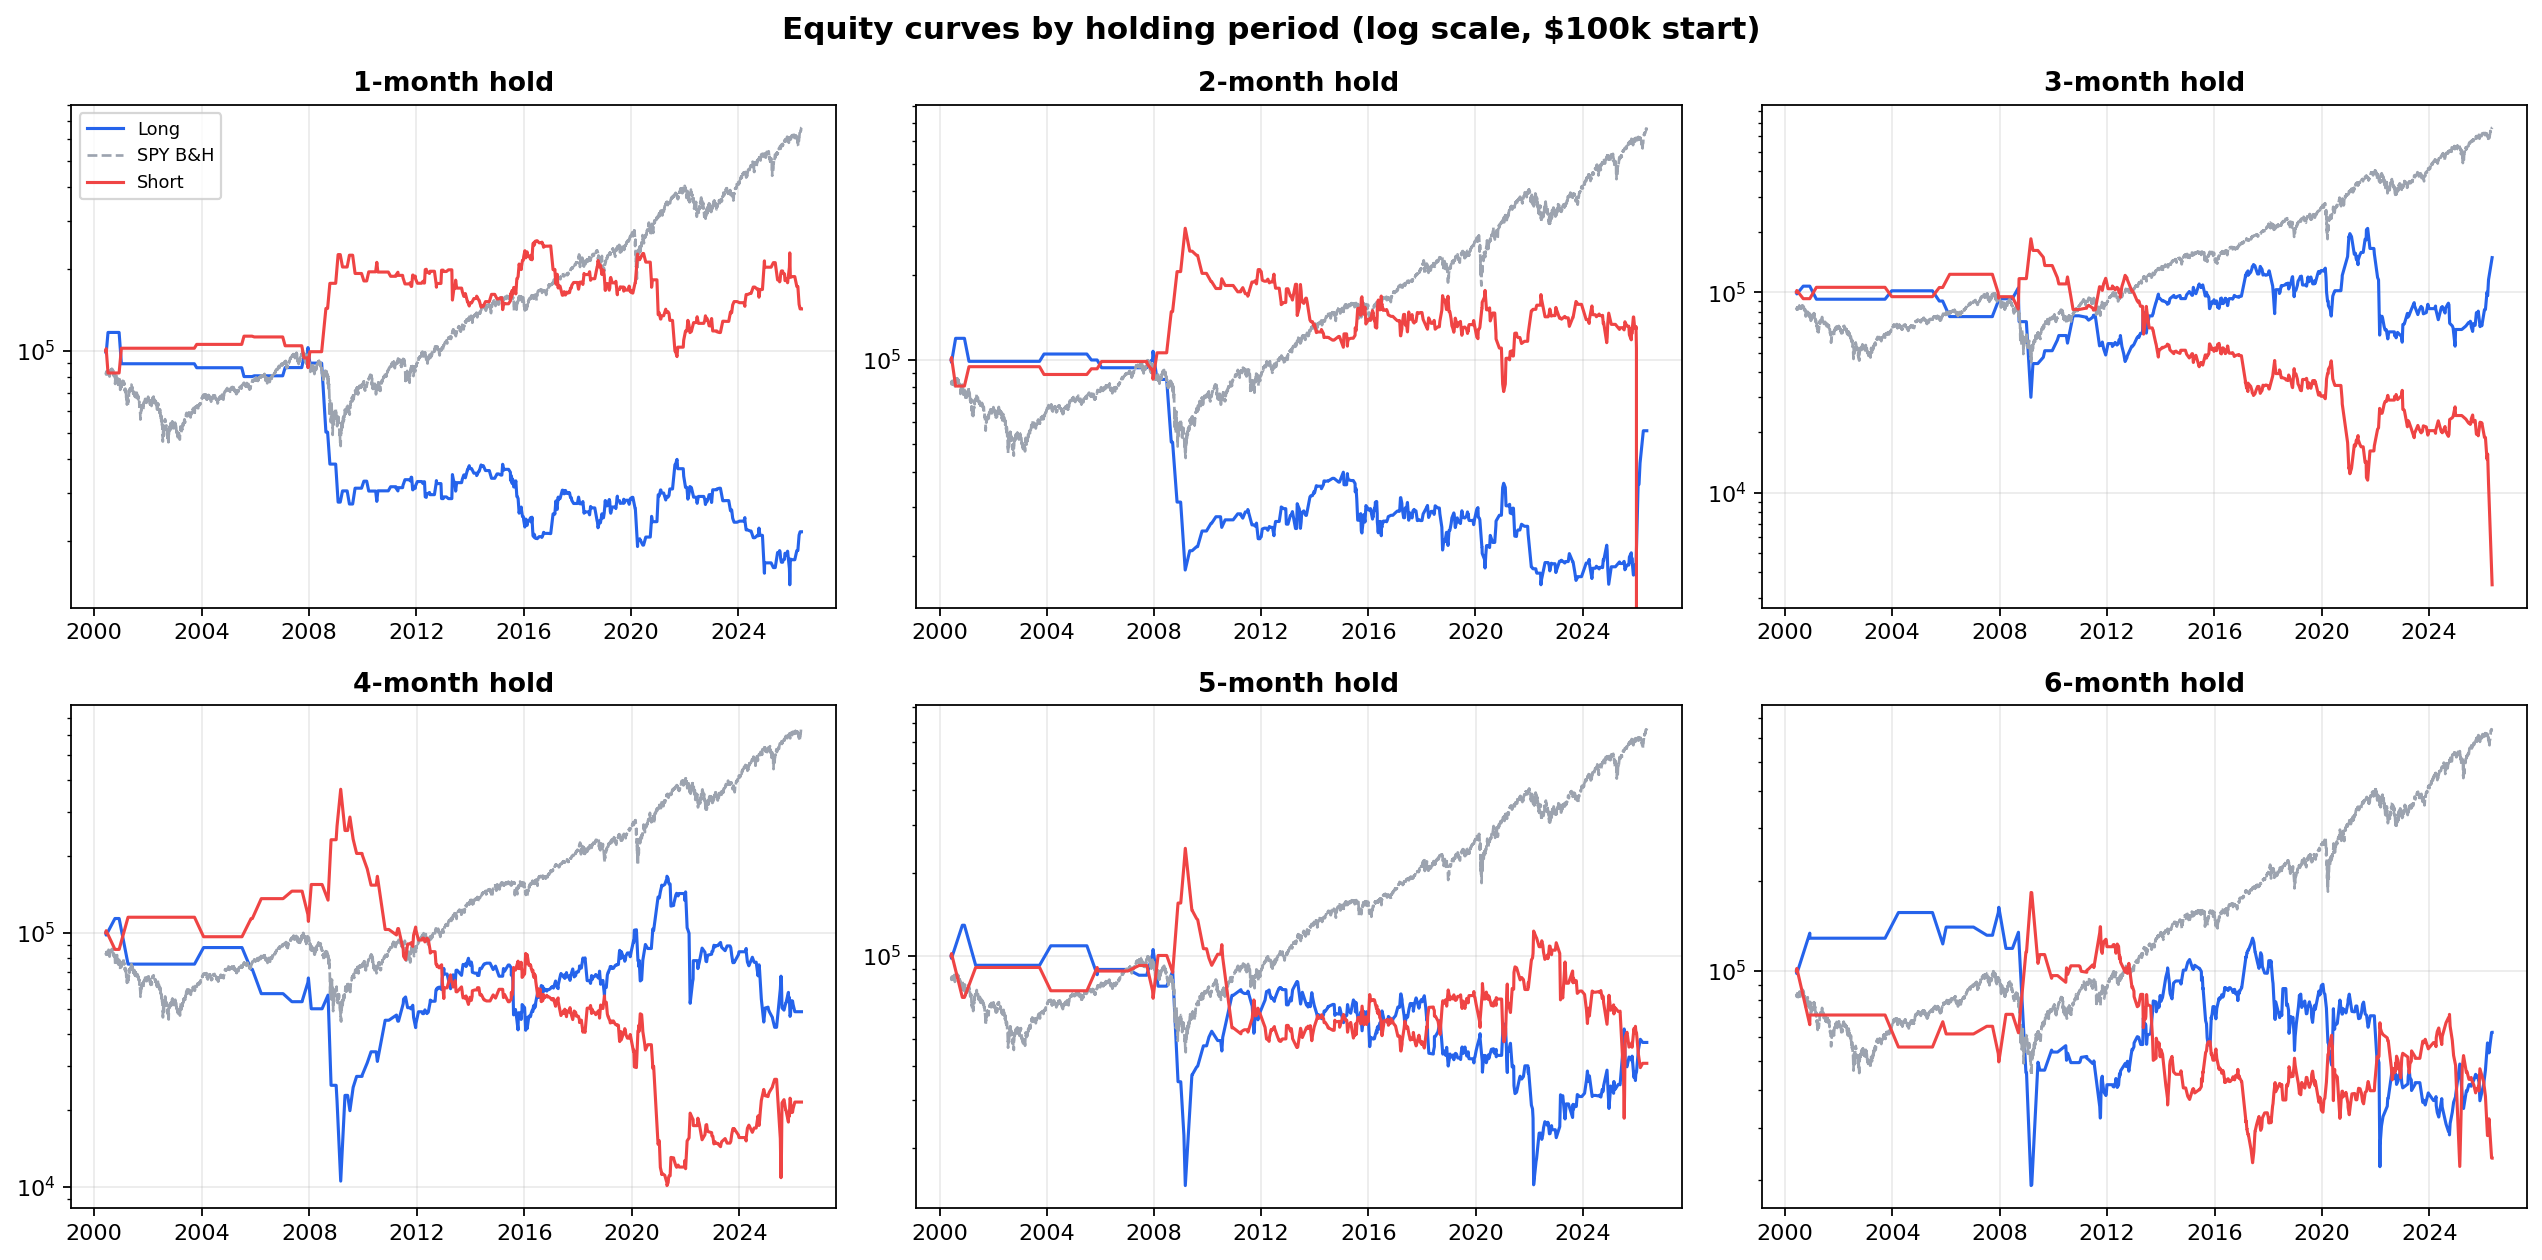
The table below shows portfolio-level outcomes for every combination of direction and holding period. Trades = positions actually opened in the simulation (after screening and capital constraints). Note the gap between per-trade statistics (win rate, average return) and total portfolio return — overlapping positions, losing streaks, and tax drag compound into outcomes that look very different from individual trade averages.
| Direction | Hold | Trades | Win rate | Avg net return | Median net return | Total return | Final equity | SPY return | Excess vs SPY |
|---|---|---|---|---|---|---|---|---|---|
| Long | 1 month | 163 | 52.1% | −0.40% | +0.19% | −78.4% | $21,644 | +563.7% | −642.0 pp |
| Short | 1 month | 161 | 47.2% | +0.28% | −0.19% | +42.8% | $142,762 | +563.7% | −520.9 pp |
| Long | 2 months | 126 | 52.4% | +0.97% | +0.61% | −44.1% | $55,901 | +573.5% | −617.6 pp |
| Short | 2 months | 123 | 47.2% | −0.62% | −0.60% | −114.8% | −$14,802 | +573.5% | −688.3 pp |
| Long | 3 months | 88 | 59.1% | +3.65% | +3.35% | +48.7% | $148,724 | +563.7% | −515.0 pp |
| Short | 3 months | 86 | 41.9% | −1.90% | −3.04% | −96.5% | $3,473 | +563.7% | −660.2 pp |
| Long | 4 months | 65 | 49.2% | +1.00% | −0.96% | −51.1% | $48,946 | +539.2% | −590.2 pp |
| Short | 4 months | 63 | 49.2% | −1.35% | −2.87% | −78.4% | $21,583 | +539.2% | −617.6 pp |
| Long | 5 months | 71 | 54.9% | +2.86% | +2.80% | −51.5% | $48,523 | +569.2% | −620.7 pp |
| Short | 5 months | 57 | 45.6% | −1.44% | −2.80% | −59.3% | $40,753 | +569.2% | −628.5 pp |
| Long | 6 months | 47 | 53.2% | +3.33% | +1.37% | −37.6% | $62,391 | +545.1% | −582.7 pp |
| Short | 6 months | 68 | 42.7% | −4.39% | −3.01% | −76.3% | $23,706 | +545.1% | −621.4 pp |
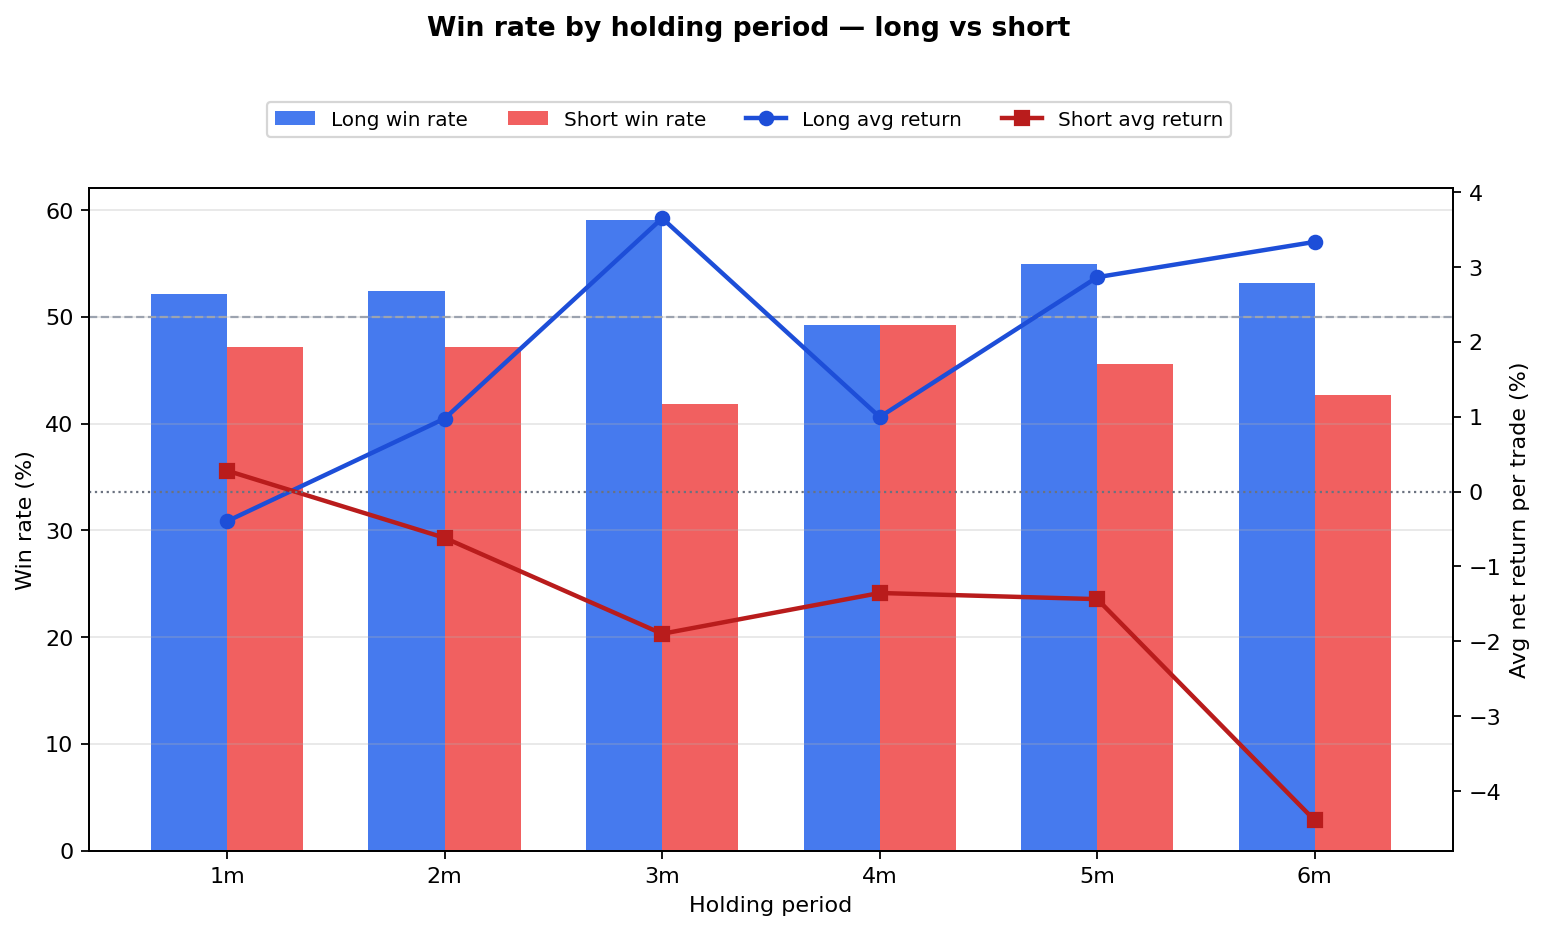
Win Rate: Longs Improve With Time, Shorts Deteriorate
One of the clearest patterns in the data is that holding period affects longs and shorts in opposite directions. For long positions, win rate rises as you extend the hold from 1 to 3 months, then stays above 50% through 6 months. For shorts, win rate starts below 50% and falls further the longer you stay short — consistent with new index members being momentum winners that are dangerous to bet against.
| Hold | Long win rate | Short win rate | Long avg return | Short avg return |
|---|---|---|---|---|
| 1 month | 52.1% | 47.2% | −0.40% | +0.28% |
| 2 months | 52.4% | 47.2% | +0.97% | −0.62% |
| 3 months | 59.1% | 41.9% | +3.65% | −1.90% |
| 4 months | 49.2% | 49.2% | +1.00% | −1.35% |
| 5 months | 54.9% | 45.6% | +2.86% | −1.44% |
| 6 months | 53.2% | 42.7% | +3.33% | −4.39% |
Longs: Win rate climbs from 52% at 1 month to a peak of 59.1% at 3 months, and average return per trade turns meaningfully positive (+3.65%). Even at 5–6 months, win rates stay in the 53–55% range with positive average returns. That fits the index-inclusion story: passive buying and momentum can keep pushing new members higher over a quarter or two.
Shorts: The pattern inverts. Win rate is already below 50% at 1 month (47.2%) and drops to 41.9% at 3 months and 42.7% at 6 months, while average returns turn sharply negative beyond the first month. The only short horizon with a positive average return is 1 month (+0.28%) — a thin fade that disappears as soon as you extend the hold. Shorting new S&P 500 additions is, in effect, fighting a structural bid that strengthens over weeks, not days.
This win-rate split is one reason the 3-month long and 1-month short look like the “best” configurations in their respective directions — but even there, portfolio-level returns still fail to beat SPY.
Deep Dive: The Best Long Variant (3-Month Hold)
The 3-month long configuration is the only variant that both makes money at the portfolio level and shows a statistically meaningful per-trade edge. With 88 traded events, a 59.1% win rate, and an average net return of +3.65% per addition, it is the closest thing to a workable signal in this dataset.
But context matters. The strategy still turned $100,000 into only $148,724 (+48.7%) over 26 years. SPY turned the same stake into $663,677 (+563.7%). The strategy underperformed the benchmark by more than 500 percentage points. Several individual years were catastrophic: 2008 (−$48,637), 2021 (−$78,694), and 2012 (−$25,496) wiped out large chunks of accumulated gains.
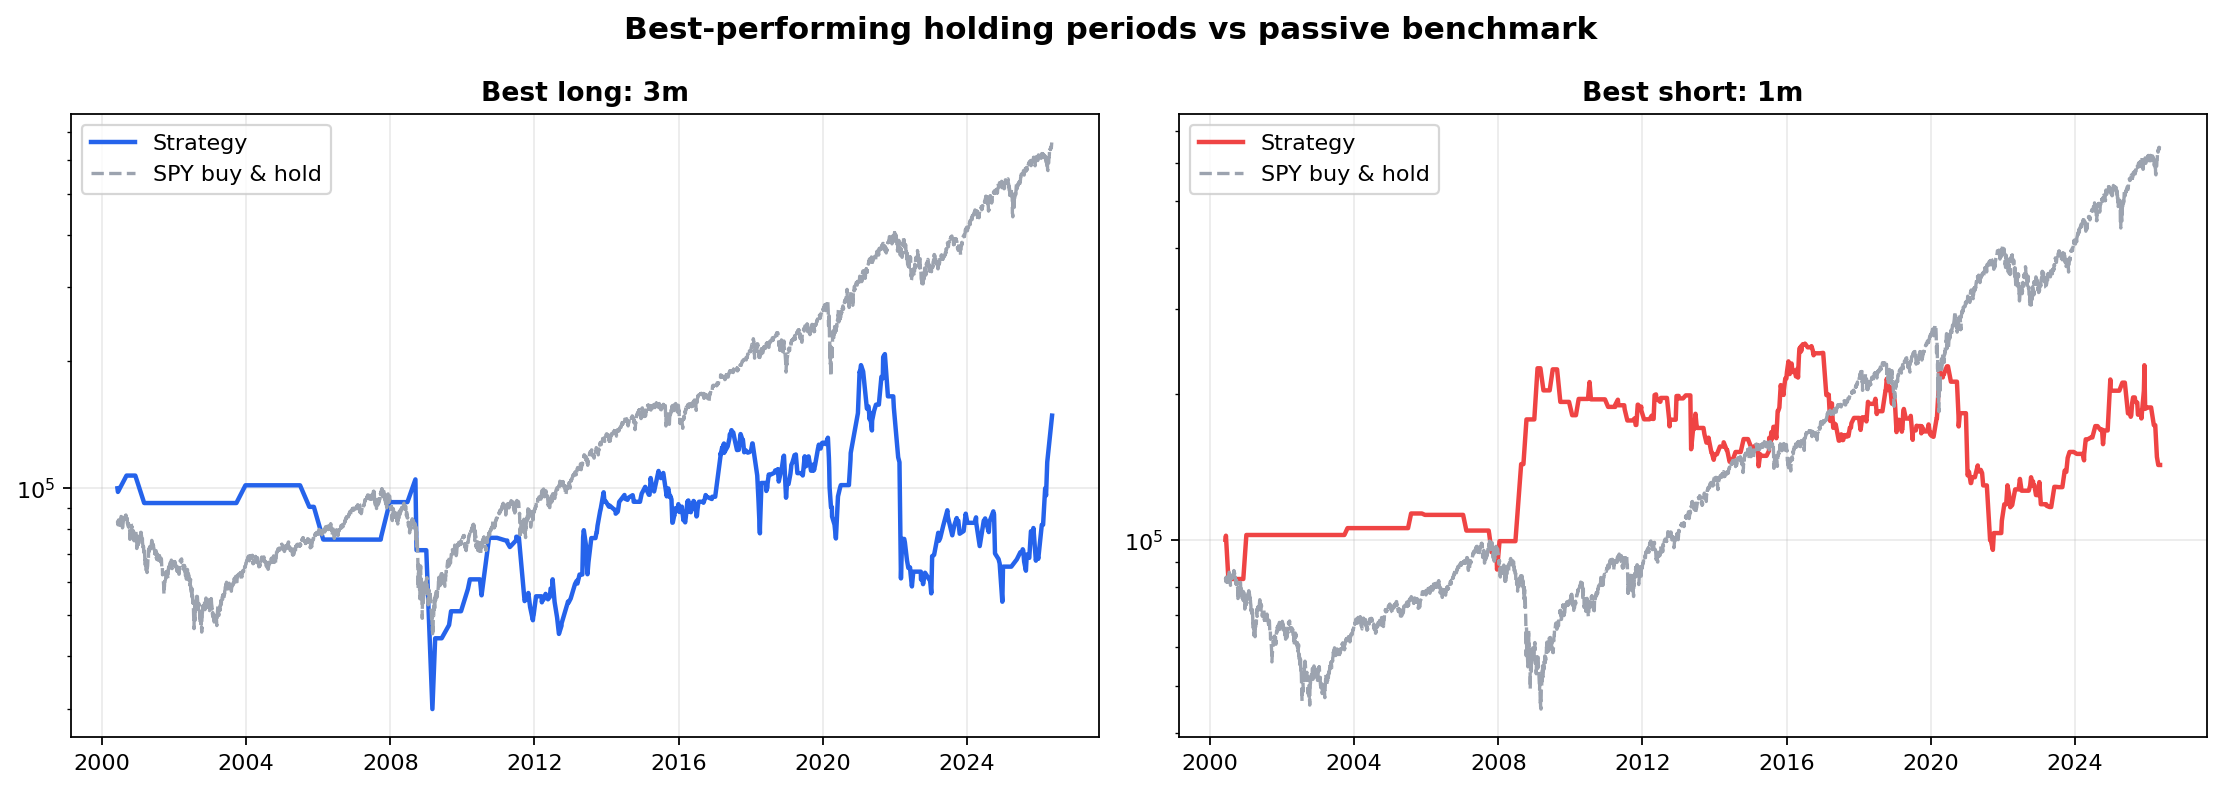
The standout individual trades explain why the 3-month window looks best on paper. Recent winners include Sandisk (+143.6% in 3 months after its 2025 addition), Ciena (+81.6% in 2026), and Etsy (+51.1% in 2020). These are high-beta, momentum-driven names that can explode after inclusion — but the losers are equally violent: EPAM Systems (−54.1%), Owens-Illinois (−38.2%), and Live Nation (−38.1%).
| Year | Trades | Win rate | Avg return | Total P&L |
|---|---|---|---|---|
| 2025 | 8 | 87.5% | +25.4% | +$13,900 |
| 2026 | 1 | 100% | +81.6% | +$66,823 |
| 2020 | 7 | 85.7% | +13.9% | +$64,283 |
| 2009 | 4 | 100% | +18.3% | +$16,735 |
| 2021 | 7 | 42.9% | −10.3% | −$78,694 |
| 2008 | 2 | 0% | −30.6% | −$48,637 |
| 2012 | 4 | 50% | −4.4% | −$25,496 |
| 2019 | 7 | 42.9% | −9.1% | −$12,147 |
Does Shorting New Additions Work?
The short side tells an even clearer story: no, with one narrow exception. The 1-month short returned +42.8% over 26 years — positive in absolute terms, but still less than one-tenth of SPY’s return. Every other short holding period destroyed capital, with the 2-month short losing more than the entire account (−114.8%, ending at −$14,802).
This makes economic sense. New S&P 500 additions are, by construction, companies that have recently grown large and successful enough to qualify. Shorting them is betting against momentum and against the passive buying flow that index inclusion creates. The 1-month short may capture a brief post-addition fade in some cases, but extending the hold exposes you to the underlying business trend — which is usually up.
Which Industries Matter?
Aggregating results across all long holding periods, sector selection matters enormously. Some industries consistently produce positive average returns after index inclusion; others are persistent losers.
Best-performing sectors (long, ≥8 trades)
Semiconductor Equipment & Materials (+25.6% avg)
Restaurants (+15.3% avg)
Internet Retail (+15.2% avg)
Communication Equipment (+15.2% avg)
Diagnostics & Research (+14.6% avg)
Biotechnology (+10.8% avg)
Worst-performing sectors (long, ≥8 trades)
Information Technology Services (−19.8% avg)
Packaging & Containers (−11.9% avg)
Unknown / unclassified (−11.3% avg)
Software – Application (−8.4% avg)
Semiconductors (−7.0% avg)
Oil & Gas E&P (−6.0% avg)
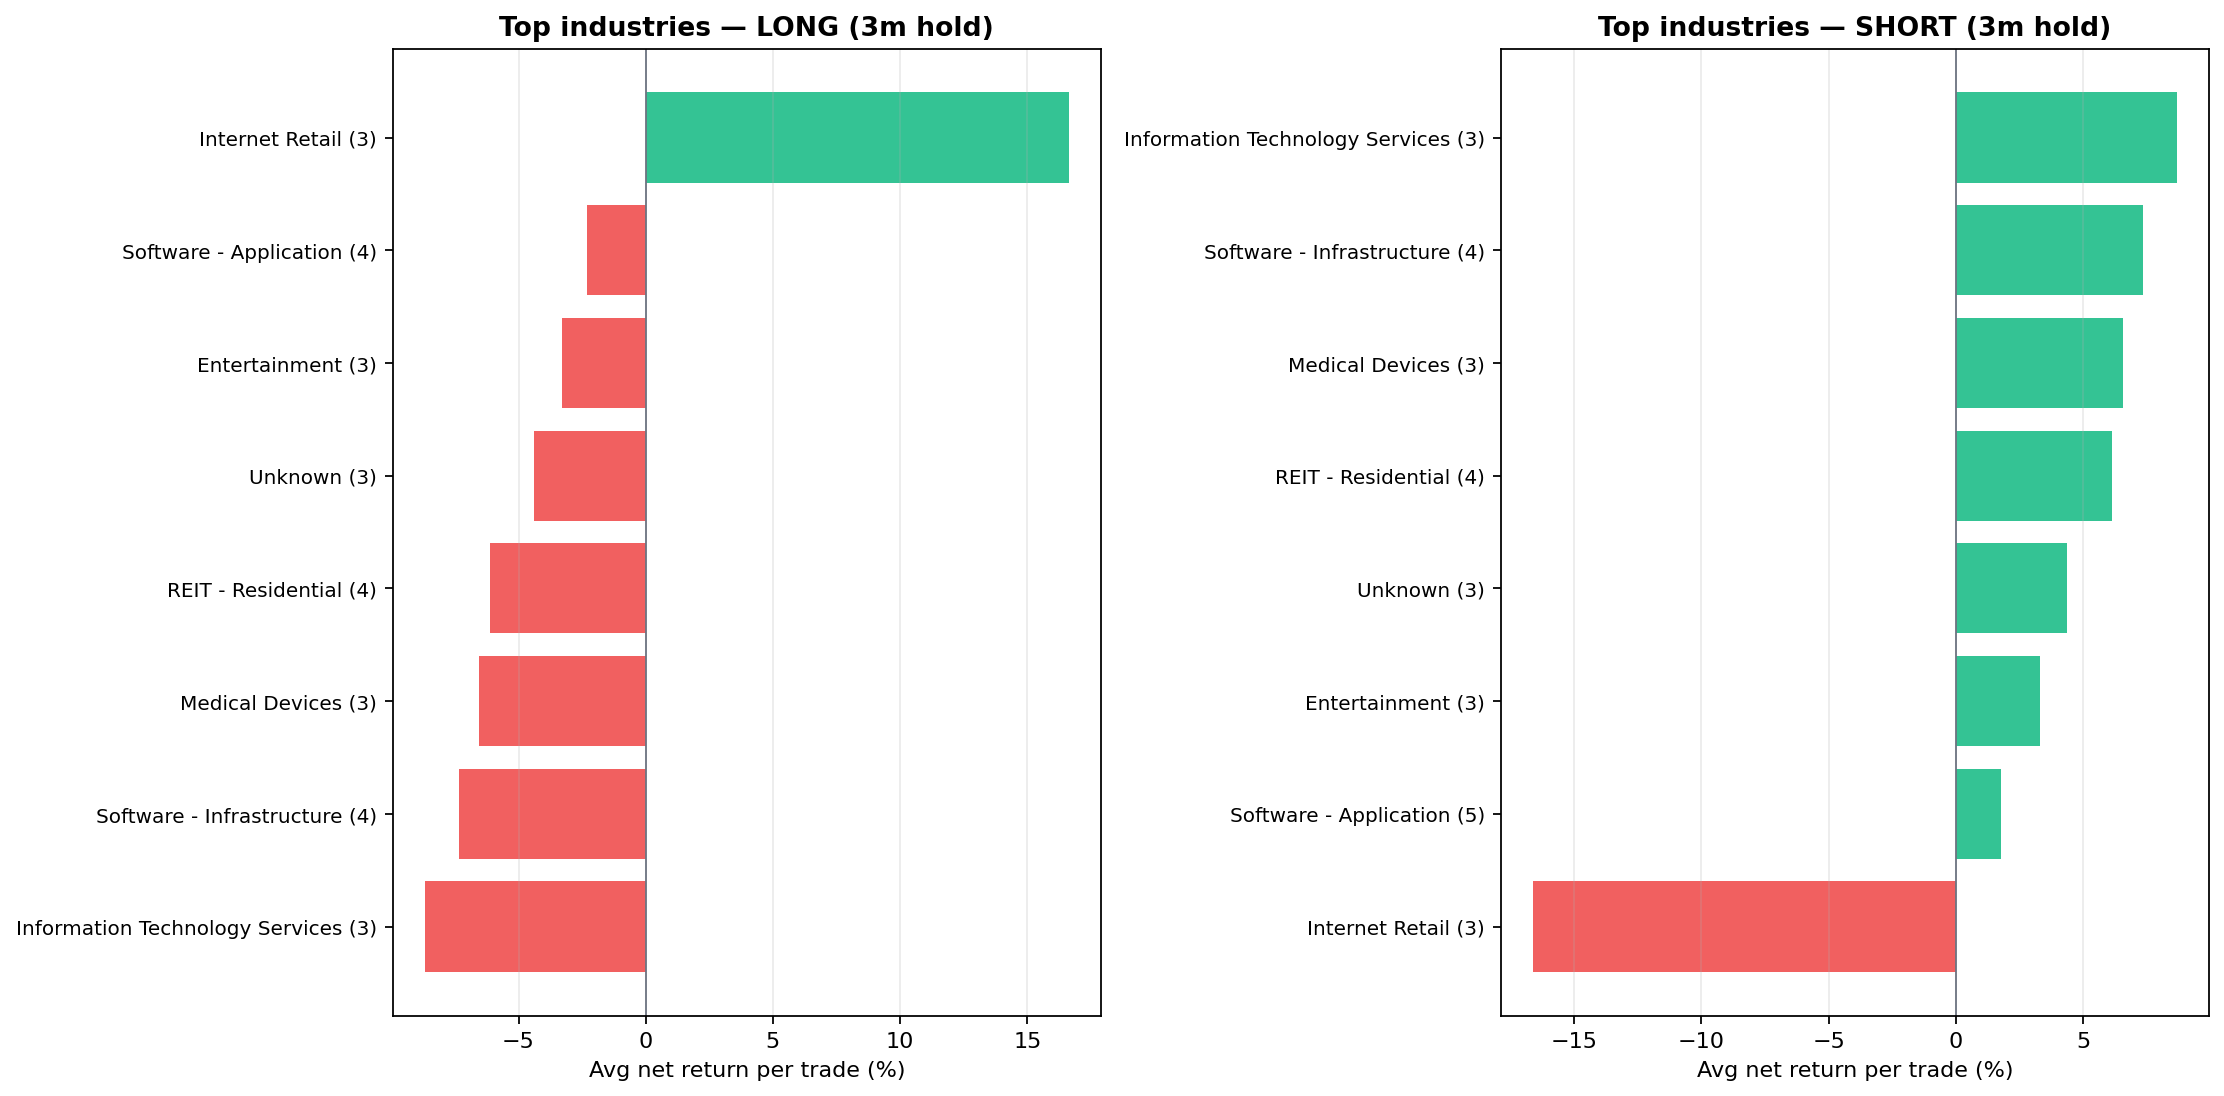
The sector split reveals an important nuance: the index inclusion effect is not uniform. Cyclical, high-momentum sectors (semiconductors, biotech, restaurants) tend to continue their run after joining the index. Mature, lower-growth sectors (IT services, packaging, oil & gas) often fade — possibly because their inclusion reflects peak size rather than peak growth.
Why a Positive Average Return Can Still Lose Money
A subtle but critical finding: several configurations show a positive average return per trade but a negative total portfolio return. The 2-month long averages +0.97% per trade yet loses 44% overall. The 5-month long averages +2.86% per trade yet loses 51.5%. How?
- Overlapping positions lock capital. When multiple additions occur close together, capital is split across concurrent trades. A large loser in one position cannot be offset by cash from a closed winner that has not yet settled.
- Tax drag is applied per batch. At 19% per closed trade, a string of small winners taxed individually erodes compounding faster than a single buy-and-hold position taxed once at the end.
- Left-tail events dominate. A single −54% trade (EPAM, 2021) or −38% trade (Live Nation, 2019) requires many +3% winners to recover. The distribution is asymmetric with fat left tails.
- Skipped events create survivorship bias. Of 235 raw addition events, 72–83 lacked usable entry/exit prices in each configuration — disproportionately failed or acquired companies. The tradable sample over-represents survivors.
Honest Verdict: Is There an Edge?
Where a limited edge may exist:
- 3-month long, sector-filtered: Restricting to high-momentum sectors (semiconductor equipment, biotech, internet retail) improves the per-trade profile materially. This is closer to a “buy the addition if it fits a growth/momentum profile” rule than a blind mechanical strategy.
- 1-month short as a fade trade: The +42.8% total return on 1-month shorts suggests a brief post-inclusion reversal exists in some cases, but the edge is thin, inconsistent, and nowhere near SPY.
- Event-driven overlay, not core strategy: The inclusion effect is best treated as a supplementary signal within a broader momentum or sector-rotation framework — not as a reason to abandon index investing.
Where the edge clearly does not exist:
- Blindly buying every new addition at any holding period without sector filter
- Shorting new additions beyond 1 month (catastrophic losses at 2–6 months)
- Expecting index-inclusion alpha to compete with passive SPY over multi-decade horizons
For investors already running systematic strategies — like the ATH momentum approach we have documented on the S&P 500 — index additions are better viewed as informational events (a large-cap stock entering a momentum phase) than as a standalone trading signal. The RavenQuant B/B Index treats macro regime and factor signals holistically; a single event-driven rule like “buy every addition” does not survive that same level of scrutiny.
Conclusion
We tested 12 configurations across 26 years of S&P 500 index additions — long and short, 1 through 6 months. The academic index inclusion effect shows up faintly in the data: new constituents do tend to outperform slightly over 3–6 month windows, especially in growth-oriented sectors. But the portfolio-level results are clear: no mechanical S&P 500 index addition strategy beat buying and holding SPY, and most variants lost money outright.
The honest takeaway for systematic investors: know the history, respect the sector context, and do not confuse a mild statistical tendency with a tradable edge. If you are going to trade index additions, do it selectively, in the right sectors, with tight risk management — and even then, treat it as a small overlay, not a foundation.