RavenQuant Combo Dashboard
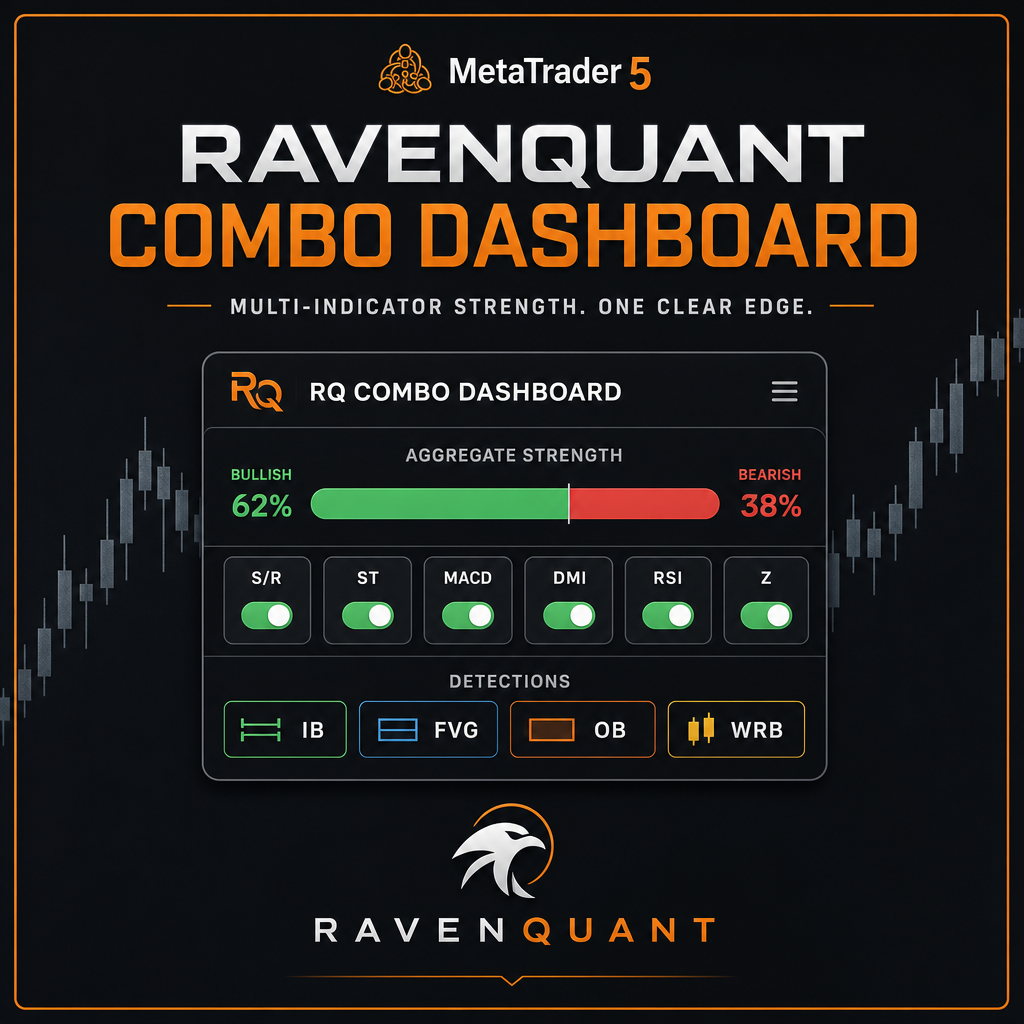
RavenQuant Combo Dashboard is a comprehensive MetaTrader 5 indicator in one floating panel: six switchable modules (support and resistance, SuperTrend, Sniper MACD, DMI+ADX, RSI, Z-Score Spring), seventeen detection types (inside and outside bars, HH/HL/LH/LL structure, FVG, order blocks, pin bars, stars, moving-average crosses, demand and supply surges and more), swing trend lines, a volume profile, and a live aggregate direction and strength read.
20.00 $
Combo Dashboard
A multi-indicator cockpit for MetaTrader 5. Toggle six indicator modules, mark candle and structure detections, draw swing trend lines and a volume profile, and read one aggregate direction and strength score — all from a single floating panel.
Modules, markers, and score together.
Switch modules without rebuilding charts.
Direction and strength, not window clutter.
Why it matters
Stop stacking five subwindows to read one chart
Combo Dashboard keeps the whole reading stack in one place. Attach or detach modules with a click, mark the bars that matter, and keep a running read on whether the enabled stack leans bullish or bearish — and how strongly.
No mystery signal service. Configurable modules, documented detection rules, and a score built only from what you switched on.
Positioning
Built for chart work with structure
Use it on FX, indices, metals, or any MT5 symbol where you want trend, momentum, and pattern context without juggling unrelated tools.
Core functions
What you can actually do
Drag it anywhere, change its width, minimize it, or close it. Reload the indicator for a clean restart and scroll long lists with buttons or the mouse wheel.
Attach or detach six indicator modules on demand. Each one keeps its own settings and can be shown on the chart but excluded from the aggregate.
Mark candle, structure, imbalance, and surge events with multi-select subtypes and configurable arrow presets.
Watch one direction and strength bar built from the enabled modules, refreshed on a timer, using the closed bar so readings stay stable.
Screens
See the panel on a live chart
Same instrument, two different stacks. The panel keeps its place while you switch modules and detections on and off.
Indicator modules
Six modules feeding direction and strength
Pivot-based breakout levels drawn on the main chart, with an optional ATR filter. Contributes direction.
ATR trend flips with optional flip markers. Contributes direction and strength.
Custom MACD with extra smoothing and an optional volume filter. Direction plus histogram strength.
DI+ and DI− for direction, ADX for strength, with your own threshold for a strong trend.
Direction against the midline and strength from the distance to it.
Price or log-return z-score with entry and exit bands, a dead zone, and optional alerts. Direction plus absolute z-score strength.
Chart tools
Levels, volume, and helpers
Fractal swing depth, number of touches, multiple line pairs, right-side extension, separate support and resistance colors, and swing markers.
Session or fixed lookback with POC, VAH, and VAL, adjustable value area, histogram width, row count, and tick, real, or automatic volume.
Open settings for any module, detection marker, trend lines, or the volume profile straight from the panel.
A built-in calculator for quick sizing and arithmetic while you work a setup.
Detection engines
Seventeen detection types, many with subtypes
Enable any mix of detectors. Multi-select groups let you keep only the subtypes you trade, and every marker carries a short tooltip with the exact rule behind it.
| Detection | What it marks |
|---|---|
| Inside bar | High below prior high and low above prior low — full compression inside the previous candle. |
| Outside bar | Engulfs the prior range. Subtypes: standard OB, power OB (body engulfs), plus bull and bear variants. |
| Reversal bar | Up-range candle closing bearish, or down-range candle closing bullish. |
| Highs and lows | Swing structure from pivots: HH, HL, LH, LL as a multi-select group. |
| High bar | Candle range above your ATR multiple — expansion. |
| Short bar | Candle range below your ATR multiple — compression. |
| WRB | Wide range bar: range larger than the maximum of N prior bars. |
| Key reversal | Downtrend: new low with close above prior high (buy). Mirrored logic in an uptrend. |
| Reversal inside | Inside bar closing against the SMA trend. |
| Hidden smash | Renews the extreme, closes in the opposite zone, leaves a long wick. |
| Doji | Very small body relative to range — indecision. |
| Pin bars | Small body with one long wick: hanging man, hammer, shooting star, inverted hammer. |
| Stars | Three-candle morning and evening star, with an optional trend filter. |
| FVG | Fair value gap: bullish and bearish three-candle imbalances. |
| Order blocks | Opposing candle plus FVG plus BOS. Unmitigated, mitigated, and invalidated states with demand/supply zones. |
| MA cross | Golden and death cross, with both moving averages drawn on the chart. |
| Surge | Demand and supply displacement: ATR range, close zone, body ratio, tick RVOL, optional OBV confirmation. |
One indicator instead of a cluttered chart
Get Combo Dashboard for $20 and run modules, detections, levels, volume, and the aggregate read from a single panel.
Workflow
How it works
Attach it to a chart
Drop the indicator on any MT5 chart and place the panel where you want it.
Enable your stack
Switch on the modules and detections you care about, and exclude anything you want to see but not score.
Trade the context
Use the markers, levels, volume profile, and aggregate bar together. The decision stays yours; the inputs get clearer.
FAQ
Frequently asked questions
1) What is Combo Dashboard?
A MetaTrader 5 indicator that combines six switchable indicator modules, seventeen detection types, swing trend lines, a volume profile, and one aggregate direction and strength read in a single floating panel.
2) Who is it for?
Traders who want structured chart context on MT5 without managing a pile of separate indicators, drawings, and subwindows by hand.
3) Which platform does it need?
MetaTrader 5. It installs as a compiled indicator in your MQL5 Indicators folder together with the companion modules it loads.
4) How is the aggregate score calculated?
Enabled modules contribute a direction vote and, where applicable, a strength value. The panel combines them into a single direction and strength bar, refreshed on a timer.
5) Can I keep a module visible but out of the score?
Yes. Each module can be excluded from the aggregate while staying on the chart.
6) Which parameters can I change?
Periods and prices for every module, ATR multipliers, surge filters, order-block zone modes, moving-average cross periods, trend-line and volume-profile settings, colors, lookback, and the bar shift used for signals.
7) Does it repaint?
Readings use the closed bar by default, so the aggregate does not flicker with every tick. You can change the shift if you prefer the live bar.
8) Does it place trades?
No. Combo Dashboard is an indicator. It marks and measures; it does not send orders.
9) Which timeframes and symbols work?
Any symbol and timeframe available in your terminal. Volume-based features depend on the tick or real volume your broker provides.
10) Is this financial advice?
No. It is a research and charting tool. Trading involves risk of loss, and past patterns do not guarantee future results.
Combo Dashboard — multi-indicator strength, detections, and one clear read.
Get the productDo you need help?
Latest posts
-
Odds of Beating the S&P 500: The Painful Turn After 2015
Research S&P 500 Jan 1996 to Aug 2026 · point-in-time names A random S&P 500 stock beat the index in 48% of the 10-year windows I ran. That reads like a coin flip. Then I cut the same test by…
-
Seven Largest S&P 500 Companies vs the Rest of the Index, 30 Years
Research I wanted a number for one question. If you had owned only the seven largest S&P 500 companies, and you had rebuilt that list each year from the ranking that already existed, how would that have compared with the…
-
Daybreak v6: €59,000 More and a Much Smaller Drawdown
Strategies US500 €59,000 more Daybreak v6 made about €59,000 more on the same US500 test, and the equity drawdown fell from 31.1% to 10.68%. Balance drawdown went from 29.24% to 21.72%. Same morning breakout. One new exit. That is the…