I wanted a number for one question. If you had owned only the seven largest S&P 500 companies, and you had rebuilt that list each year from the ranking that already existed, how would that have compared with the other stocks in the index, and with the index itself, over the last 30 years?
The reason to run it is the concentration sitting in the index now. At the December 1995 close the seven were 10.5% of the S&P 500’s stated market cap. At the December 2025 close they were 35.1%. A third of the index is seven names. The shortcut most write-ups use is to take today’s seven and replay them through 1996. That list is the platform companies of the last few years. The 1996 basket was Exxon, Coca-Cola, General Electric, Merck, Procter & Gamble, Johnson & Johnson, and Microsoft. Only Microsoft is still in the seven that 2026 is holding. I already wrote up how to walk membership backward from the published additions and removals, in how to build historical S&P 500 constituents, so a name enters this test only once it was actually in the index.
The test is the version you could have held with the ranking already on the table. Each January I take the seven largest companies on the prior year-end market-cap list, weight them by those market caps, and keep that mix until the next January. A name that passes another in March waits for the next ranking. The rest of the index is whatever is left after those seven are removed. The whole index has to land between the two, because the seven sit inside it. Monthly total returns, dividends included, from January 1996 through September 2026.
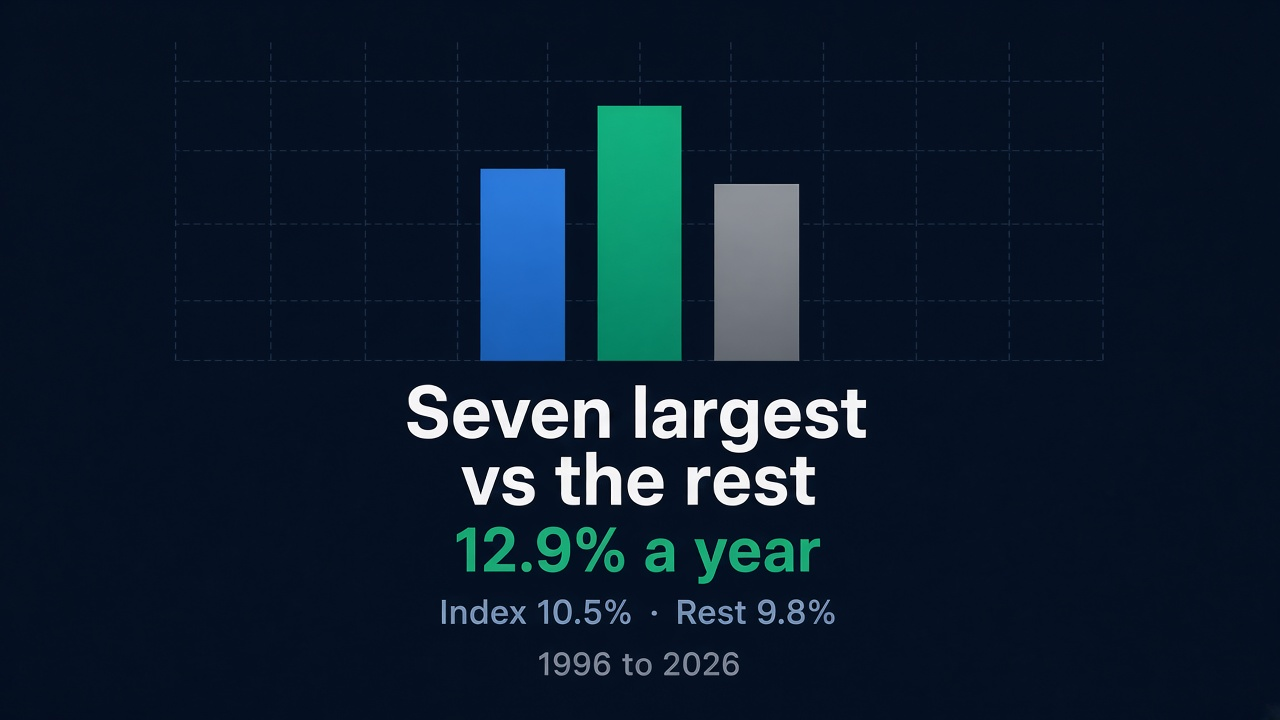
On that rule the seven returned 12.9% a year. The S&P 500 total return index returned 10.5%. The other stocks returned 9.8%. $10,000 at the December 1995 close became about $422,100 in the seven, $216,700 in the index, and $175,500 in the rest. The extra return is the compound. The path was rougher than the index.
Refreshed each January from the ranking that already existed, the seven returned 12.9% a year, the index 10.5%, and the other stocks 9.8%. On $10,000 that is about $422,100, $216,700, and $175,500.
The lead shows up after 2010. From 1996 through 2009 all three were about 6% a year. The seven finished ahead of the index in 19 of 30 full years. From 2014 through 2025 the only full year they lagged was 2022.
The win was the compound, and the drop was deeper: -54.7% for the seven at the worst point, against -50.9% for the index. If you already own the S&P 500, you already own these seven. In 1996 that was about a tenth of the fund. At the start of 2026 it is about a third.
12.9%
a year, the seven
10.5%
a year, the whole index
9.8%
a year, the other stocks
-54.7%
worst drop, the seven
What the seven largest S&P 500 companies actually returned
I held each year-end roster for the following calendar year. January 1996 uses the 29 December 1995 ranking. January 2026 uses 31 December 2025. A name leaves in January, and only in January. I look at the ranking dated the previous year-end, keep the seven names on it, and drop the rest. Nothing is swapped in March because one company passed another during the spring. Procter & Gamble and Johnson & Johnson were in the 1996 seven and out of the 1997 seven. Intel and IBM came in. That new list earns the January 1997 return, from the December 1996 close to the January 1997 close. The ranking was already public, so the year being traded is not used to pick the names.
Inside the seven, the weights are those year-end market caps divided by the sum of the seven. I put those percentages back every month until the next January. A stock that runs ahead does not get a bigger share of the basket until the next ranking. The basket’s share of the whole index does drift. It starts as the seven’s combined market cap divided by the S&P 500 market cap printed on the same table, then moves with relative performance: new share equals old share times (1 + return of the seven) divided by (1 + return of the index). In January I reset it to the new table.
The rest of the index is the leftover. If the index returned 2% and the seven, at a 20% share, returned 5%, the other stocks returned (2% minus 0.20 times 5%) divided by 0.80, which is 1.25%. That is an identity. It is the index with the seven removed, not a second list of names I went out and bought.
| Basket | End value of $10,000 | CAGR | Worst drop |
|---|---|---|---|
| Seven largest, cap-weighted | $422,100 | 12.94% | -54.7% |
| S&P 500 total return | $216,700 | 10.52% | -50.9% |
| The other stocks | $175,500 | 9.76% | -52.5% |
The index sits between the other two, which is what the arithmetic says it should do. In 1996 the seven were 10.5% of the index’s stated market cap. At the start of 2026 they were 35.1%. A third of the index is now the basket you are comparing the index with, so the index cannot lag the seven by as much as the rest does. The 2.4 point gap over the index, and the 3.2 point gap over the rest, are the same fact seen from two sides. Compounded, the first gap is the difference between $216,700 and $422,100. The second is the difference between $175,500 and $422,100.
On the log chart the three lines lie on top of each other for a long time. Through the mid-2000s a dollar in the seven and a dollar in the index are hard to separate. The dark line starts to pull away in the 2010s and steepens after 2019. The notch in 2022 is the year the seven give a large piece of that lead back, and 2023 and 2024 are where they take it again. A linear chart would squash the 1990s into the axis and make the last five years look like the whole history. The log scale keeps a doubling the same size whether it happens in 1998 or in 2024.
The lead showed up after 2010
Split the same path into three stretches and the 30-year average stops looking like a permanent feature of big stocks.
| Window | Seven | Rest | Index | Seven, worst drop | Index, worst drop |
|---|---|---|---|---|---|
| 1996 to 2009 | 6.05% | 6.11% | 5.98% | -54.7% | -50.9% |
| 2010 to 2019 | 17.85% | 13.29% | 14.10% | -17.4% | -16.3% |
| 2020 to Sep 2026 | 20.93% | 13.03% | 15.54% | -39.9% | -23.9% |
Through 2009 you could not have told the three apart on return. The seven were a hair behind the rest and a hair ahead of the index, and they fell a bit further in the crisis. Those years are oil, drugs, GE, Walmart, then the banks. The seven were large, and they were also a small slice of the index, around 10% to 18%. Owning them was close to owning the market because the market was not yet a bet on seven names.
The 2010s are where the gap opens, about 4 points a year over the rest, with drawdowns that still look alike. Apple is in the basket from the 2010 holding year and never leaves. Amazon and Facebook join for 2016. The share of the index is still in the mid-teens for most of that decade, so the index can lag the seven without becoming a different investment.
Since 2020 the seven have run at 20.9% against 13.0% for the rest and 15.5% for the index, and the price of that run is a 40% hole against a 24% hole in the index. By the start of 2026 the seven are 35% of stated market cap. At that weight, a bad stretch for the basket moves the index whether you hold the seven as a separate account or only through the index itself.
Each calendar year
The same path, one row per year. A full year runs from the prior December close to that December close. 2026 stops at September, nine months, on the 31 December 2025 roster. Shaded rows are the years the seven finished behind the index. There are 11 of them in the 30 complete years, so the seven finished ahead in 19. They finished ahead of the rest in those same 19 years. From 2014 through 2025 the only full year they lagged was 2022.
| Year | Seven | Rest | Index | Seven vs index | Seven, worst drop |
|---|---|---|---|---|---|
| 1996 | +36.9% | +21.3% | +23.0% | +13.9 | -3.3% |
| 1997 | +36.1% | +33.0% | +33.4% | +2.7 | -10.6% |
| 1998 | +43.7% | +26.5% | +28.6% | +15.1 | -12.7% |
| 1999 | +43.5% | +17.4% | +21.0% | +22.5 | -7.8% |
| 2000 | -24.1% | -5.6% | -9.1% | -15.0 | -30.1% |
| 2001 | -5.2% | -13.1% | -11.9% | +6.7 | -23.7% |
| 2002 | -23.1% | -21.9% | -22.1% | -1.0 | -30.7% |
| 2003 | +16.7% | +31.2% | +28.7% | -12.0 | -3.8% |
| 2004 | +1.5% | +12.7% | +10.9% | -9.4 | -5.7% |
| 2005 | +1.4% | +5.5% | +4.9% | -3.5 | -4.9% |
| 2006 | +19.4% | +15.2% | +15.8% | +3.6 | -1.2% |
| 2007 | +0.8% | +6.3% | +5.5% | -4.7 | -6.0% |
| 2008 | -27.2% | -38.7% | -37.0% | +9.8 | -27.2% |
| 2009 | +5.5% | +31.1% | +26.5% | -21.0 | -15.5% |
| 2010 | +8.4% | +16.3% | +15.1% | -6.7 | -12.5% |
| 2011 | +12.8% | +0.3% | +2.1% | +10.7 | -7.2% |
| 2012 | +13.6% | +16.5% | +16.0% | -2.4 | -9.3% |
| 2013 | +26.0% | +33.6% | +32.4% | -6.4 | -3.6% |
| 2014 | +16.0% | +13.3% | +13.7% | +2.3 | -4.5% |
| 2015 | +5.1% | +0.7% | +1.4% | +3.7 | -6.8% |
| 2016 | +13.8% | +11.6% | +12.0% | +1.9 | -5.5% |
| 2017 | +35.8% | +19.2% | +21.8% | +14.0 | -2.3% |
| 2018 | +3.2% | -6.1% | -4.4% | +7.6 | -17.4% |
| 2019 | +41.9% | +28.9% | +31.5% | +10.4 | -8.1% |
| 2020 | +45.6% | +10.7% | +18.4% | +27.2 | -14.6% |
| 2021 | +36.4% | +25.8% | +28.7% | +7.7 | -5.8% |
| 2022 | -39.9% | -9.1% | -18.1% | -21.8 | -39.9% |
| 2023 | +45.8% | +20.3% | +26.3% | +19.5 | -6.1% |
| 2024 | +47.1% | +15.5% | +25.0% | +22.1 | -2.2% |
| 2025 | +25.5% | +14.1% | +17.9% | +7.6 | -14.5% |
| 2026 to Sep | +15.5% | +11.2% | +12.7% | +2.8 | -10.6% |
Inside a single year the seven had the deeper drop in 18 of those 30 full years. The two years that dominate the long drawdown numbers are 2008, where the seven fell less than the index (-27.2% against -37.0%), and 2022, where they fell much more (-39.9% against -18.1%).
The late 1990s are the seven at their widest early lead. In 1999 the basket was Microsoft, GE, Intel, Walmart, Exxon, Coca-Cola, and IBM, up 43.5% against 21.0% for the index. The next January that list had become Microsoft, Cisco, Walmart, GE, Exxon, Intel, and Citigroup, and 2000 gave it back: -24.1% against -9.1% for the index. Owning whatever had just become huge is the same rule in both years. One year it paid, the next year it was the thing that had been bid up.
The rebound years belong to the rest. 2003, 2004, 2005, 2009, and 2010 are all shaded. In 2009 the seven were Exxon, Walmart, Procter & Gamble, Microsoft, Johnson & Johnson, Chevron, and AT&T. That is a defensive list. It rose 5.5% while the index rose 26.5%. The snapback was happening in the names that were not already the biggest.
2008 is the exception that makes the roster matter. The seven that year were Exxon, Microsoft, Procter & Gamble, GE, Alphabet, Chevron, and Walmart. Energy and staples, with the banks already out of the top seven. They fell 27.2%. The rest of the index fell 38.7%. Size alone did not cushion anything. The cushion was what size happened to be that January.
From 2014 through 2025 the only full year the seven lagged was 2022, and the roster explains the size of it. The 2022 basket was Apple, Microsoft, Alphabet, Amazon, Tesla, Meta, and Nvidia. It fell 39.9%. The rest fell 9.1%. Then 2023 and 2024 handed the lead straight back, by 19.5 and 22.1 points. One bad year in that stretch was large enough to set the whole post-2020 drawdown, and not large enough to erase the compound lead. Add 2020’s 27.2 point gap and those three years are most of why the post-2020 row looks so strong.
The 1996 list and the 2026 list barely overlap
Only Microsoft is in both. The 1996 basket, taken from 29 December 1995, was Exxon, Coca-Cola, General Electric, Merck, Procter & Gamble, Johnson & Johnson, and Microsoft, together 10.5% of the index. The 2026 basket, taken from 31 December 2025, is Nvidia, Apple, Alphabet, Microsoft, Amazon, Meta, and Broadcom, together 35.1%. Every holding year is below, seven names, largest first. Facebook stays Facebook until the company renamed itself. The 12 October 2026 live table is not in this list.
Read the share column as the starting weight for that year: the seven market caps added up, divided by the S&P 500 market cap printed on the same table. Prices then move the weight around until the next January.
The handoff is slow and then sudden. The 1990s list is oil, soda, drugs, soap, and one software company. Intel and IBM rotate through. Cisco is in the basket for 2000 and 2001 and then gone. Citigroup, and later Bank of America, sit in the seven through the mid-2000s. Neither is in the 2008 basket, the year the banks broke. Apple joins for 2010 and stays. Amazon and Facebook join for 2016. Berkshire is the name that is not a platform stock and still stays for most of the 2010s. Nvidia joins for 2022, the year that list falls 40%. UnitedHealth is in for a single year, 2023, after that drop. Tesla is in for 2021, 2022, 2024, and 2025, and out of the 2026 seven, where Broadcom takes the last seat.
| Year traded | Ranking date | The seven, largest first | Share of index cap |
|---|---|---|---|
| 1996 | 29 Dec 1995 | Exxon, Coca-Cola, GE, Merck, P&G, J&J, Microsoft | 10.5% |
| 1997 | 31 Dec 1996 | Coca-Cola, Exxon, Intel, Microsoft, GE, Merck, IBM | 12.1% |
| 1998 | 31 Dec 1997 | Coca-Cola, Microsoft, Exxon, GE, Intel, Merck, P&G | 12.0% |
| 1999 | 31 Dec 1998 | Microsoft, GE, Intel, Walmart, Exxon, Coca-Cola, IBM | 14.1% |
| 2000 | 31 Dec 1999 | Microsoft, Cisco, Walmart, GE, Exxon, Intel, Citigroup | 18.9% |
| 2001 | 29 Dec 2000 | Exxon, GE, Cisco, Pfizer, Walmart, Microsoft, Citigroup | 15.7% |
| 2002 | 31 Dec 2001 | Microsoft, Exxon, Citigroup, Walmart, GE, Pfizer, Intel | 17.5% |
| 2003 | 31 Dec 2002 | Microsoft, Exxon, Walmart, Citigroup, Pfizer, J&J, GE | 17.2% |
| 2004 | 31 Dec 2003 | Microsoft, Exxon, Pfizer, Citigroup, Walmart, Intel, GE | 16.5% |
| 2005 | 31 Dec 2004 | Exxon, Microsoft, Citigroup, GE, Walmart, Bank of America, Pfizer | 15.1% |
| 2006 | 30 Dec 2005 | Exxon, Microsoft, Citigroup, GE, Walmart, Bank of America, J&J | 14.7% |
| 2007 | 29 Dec 2006 | Exxon, Microsoft, Citigroup, Bank of America, GE, P&G, Walmart | 14.8% |
| 2008 | 31 Dec 2007 | Exxon, Microsoft, P&G, GE, Alphabet, Chevron, Walmart | 14.6% |
| 2009 | 31 Dec 2008 | Exxon, Walmart, P&G, Microsoft, J&J, Chevron, AT&T | 18.1% |
| 2010 | 31 Dec 2009 | Exxon, Microsoft, Walmart, Alphabet, Apple, J&J, P&G | 15.5% |
| 2011 | 31 Dec 2010 | Exxon, Apple, Microsoft, Berkshire, Walmart, Alphabet, Chevron | 14.5% |
| 2012 | 30 Dec 2011 | Exxon, Apple, Microsoft, Chevron, Alphabet, IBM, Walmart | 16.1% |
| 2013 | 31 Dec 2012 | Apple, Exxon, Alphabet, Walmart, Microsoft, Berkshire, Chevron | 15.7% |
| 2014 | 31 Dec 2013 | Apple, Exxon, Alphabet, Microsoft, Berkshire, J&J, Walmart | 14.7% |
| 2015 | 31 Dec 2014 | Apple, Exxon, Microsoft, Berkshire, Alphabet, J&J, Wells Fargo | 14.9% |
| 2016 | 31 Dec 2015 | Apple, Alphabet, Microsoft, Berkshire, Exxon, Amazon, Facebook | 15.8% |
| 2017 | 30 Dec 2016 | Apple, Alphabet, Microsoft, Berkshire, Exxon, Amazon, Facebook | 16.1% |
| 2018 | 29 Dec 2017 | Apple, Alphabet, Microsoft, Amazon, Facebook, Berkshire, J&J | 18.4% |
| 2019 | 31 Dec 2018 | Microsoft, Apple, Amazon, Alphabet, Berkshire, Facebook, J&J | 20.0% |
| 2020 | 31 Dec 2019 | Apple, Microsoft, Alphabet, Amazon, Facebook, Berkshire, JPMorgan | 22.0% |
| 2021 | 31 Dec 2020 | Apple, Microsoft, Amazon, Alphabet, Facebook, Tesla, Berkshire | 27.6% |
| 2022 | 31 Dec 2021 | Apple, Microsoft, Alphabet, Amazon, Tesla, Meta, Nvidia | 29.2% |
| 2023 | 30 Dec 2022 | Apple, Microsoft, Alphabet, Amazon, Berkshire, UnitedHealth, J&J | 23.3% |
| 2024 | 29 Dec 2023 | Apple, Microsoft, Alphabet, Amazon, Nvidia, Meta, Tesla | 30.1% |
| 2025 | 31 Dec 2024 | Apple, Nvidia, Microsoft, Alphabet, Amazon, Meta, Tesla | 33.3% |
| 2026 | 31 Dec 2025 | Nvidia, Apple, Alphabet, Microsoft, Amazon, Meta, Broadcom | 35.1% |
This is not a 30-year hold of today’s Magnificent Seven, pasted backward. Nvidia is not in the basket until the 2022 calendar year, which uses the 2021 year-end ranking. Tesla shows up for 2021, 2022, 2024, and 2025, then drops out of the 2026 seven. GE is a giant in the 1990s and gone from the seven long before the 2020s. If you freeze today’s list and replay it through 1996, you are answering a different question, and you are using information nobody had.
How the baskets were built
The seven largest S&P 500 companies in each row come from the year-end top-20 tables on Finhacker’s S&P 500 market-cap page. Each table has a real as-of date. I take the first seven names, their market caps, and the S&P 500 market cap printed in that table’s footer. The live 12 October 2026 table on that page is not a finished year, so it never becomes a holding. 2026 year-to-date uses the 31 December 2025 seven.
Monthly total returns are Yahoo adjusted closes. The index is the S&P 500 total return series. No month in the window was missing a price.
Membership is a separate check, and it matters. A ranking that quietly includes a stock the index had not added yet would flatter the test. I checked each name against a point-in-time S&P 500 roster built the way I described in how to build historical S&P 500 constituents: today’s list walked backward with the published addition and removal history, not today’s 500 copied onto 1996. That reconstruction runs through 2019 in the file I used. Every name in the seven for those years is in the index at the January snapshot, with one ticker quirk. Berkshire’s Class B does not appear as BRK in the January 2010 snapshot of that free file. Berkshire was an S&P 500 company. The file stops in 2019, so 2020 through 2025 rest on the Finhacker ranking, which is already an S&P 500 list, without a second membership file behind it.
Two approximations sit in the numbers. S&P index weights are float-adjusted. These baskets use the full market caps on the ranking page, so the slice I remove from the index is close to the official weight, not identical to it. And the roster is frozen for a calendar year. The real index adds and drops names in between.
I also charged nothing to trade. If you held the seven as separate stocks, January would be a set of sales whenever a name dropped out, and a taxable account would owe tax on the gains. Dividends are already inside these returns, through adjusted closes, and those dividends are taxable too. The 12.9% is the path with none of that subtracted. One fund that already owns the whole index includes these seven at their index weight. Buying the seven again, on top of that fund, is a second bet on the same names. At a 35% starting weight, that second bet is most of what you think of as “the market.”
What the 30 years say
The seven largest S&P 500 companies returned 12.9% a year from January 1996 through September 2026. The index returned 10.5%. The other stocks returned 9.8%. On $10,000 that is about $422,100, $216,700, and $175,500. The gap over the index is about 2.4 points a year. The gap over the rest is about 3.2. Both are large once they compound, and both describe the same split: the index is a blend of the seven and everything left behind.
The lead is a late part of the sample. From 1996 through 2009 the seven returned 6.05% a year, the rest 6.11%, and the index 5.98%. The lines separate in the 2010s, by about 4 points a year over the rest, and they separate further after 2020: 20.9% for the seven, 15.5% for the index, 13.0% for the rest. In the 30 complete calendar years the seven finished ahead of the index 19 times. From 2014 through 2025 the only full year they lagged was 2022, at -39.9% against -18.1% for the index.
The extra return came with a deeper hole. The worst drop in the full window is -54.7% for the seven, -52.5% for the rest, and -50.9% for the index. Since 2020 the seven’s worst drop is -39.9%, against -23.9% for the index. In 2008 the January roster was energy and staples, the banks had already left the seven, and the basket fell less than the index. In 2022 the roster was Apple, Microsoft, Alphabet, Amazon, Tesla, Meta, and Nvidia, and the basket fell much more.
If you already own an S&P 500 fund, you already own this basket at its index weight. In 1996 that was about a tenth of the fund. At the start of 2026 it is about a third. The 12.9% is what that slice earned on its own, refreshed every January. Buying the seven again, on top of the fund, is a second position in the same names. At a 35% weight, a bad stretch for those names moves the index either way. The 2020 to 2026 stretch is the case in point: higher return, and a drop the rest of the index did not share.
A few limits sit next to the number. The rest of the index, as I defined it, is the leftover after the seven are removed. That is an accounting identity, and no single listed product matches it. An equal-weight fund of the other names would be a different portfolio, and I did not run that. The 12.9% also charges no commission and no tax. Held as seven separate stocks, every January that drops a name is a sale, and a taxable account would owe tax on the gains. Dividends are inside the return, and those are taxable too. The roster stays frozen for a calendar year, while the real index adds and drops names in between. The weights here are full market cap, while the official index uses float-adjusted weights.
Own the biggest seven, using only the ranking you already had, and over these 30 years you finished ahead of the index and ahead of the stocks you left out. The first 14 years of that record are a tie. The years after 2010 are where the gap was earned, and they are the years the basket grew from about a tenth of the index to about a third.
FAQ
Did the seven largest S&P 500 companies beat the index?
Yes, over January 1996 through September 2026. 12.94% a year against 10.52% for the S&P 500 total return. $10,000 became about $422,100 against about $216,700.
Did they beat the rest of the index?
Yes. The residual basket, the index with that year’s seven removed, returned 9.76% a year and turned $10,000 into about $175,500. The whole index lands between the seven and the rest because the seven are inside the index.
Was the lead there for the whole 30 years?
No. From 1996 through 2009 the seven returned 6.05%, the rest 6.11%, and the index 5.98%. The gap opens in the 2010s and widens after 2020.
Did the biggest stocks fall less?
No. The worst drop in the full window is -54.7% for the seven, -52.5% for the rest, and -50.9% for the index. From 2020 through September 2026 the seven fell 39.9% at the worst point, against 23.9% for the index and 21.1% for the rest.
Is this just today’s big tech held for 30 years?
No. Each year uses only the ranking that already existed at the prior year-end. The 1996 seven were Exxon, Coca-Cola, GE, Merck, Procter & Gamble, Johnson & Johnson, and Microsoft. Nvidia enters the traded basket in 2022.
How do you know those companies were in the S&P 500 at the time?
Through 2019 I checked them against a point-in-time membership file built from the index’s addition and removal history, the method in the historical constituents article. They match, aside from Berkshire’s Class B ticker in the January 2010 snapshot. The free file ends in 2019. Later years use the Finhacker S&P 500 ranking as the membership source.
Would I have owed tax to run this?
The published 12.9% charges no commission and no capital-gains tax. Held as seven separate stocks, every January that drops a name is a sale. Dividends, which are included in the return, are taxable in a taxable account as well. A single fund that owns the index does not send you a tax bill for each name that leaves the top seven.
Can I buy “the rest of the index” the way this test defines it?
Not as a single listed product that matches this residual. The rest here is an accounting identity: index return equals the seven’s weight times the seven’s return, plus the leftover weight times the leftover return. An equal-weight fund of the other names would be a different bet.