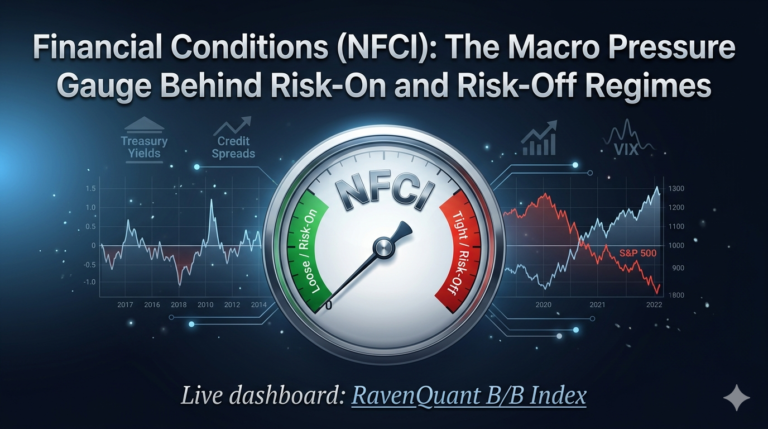
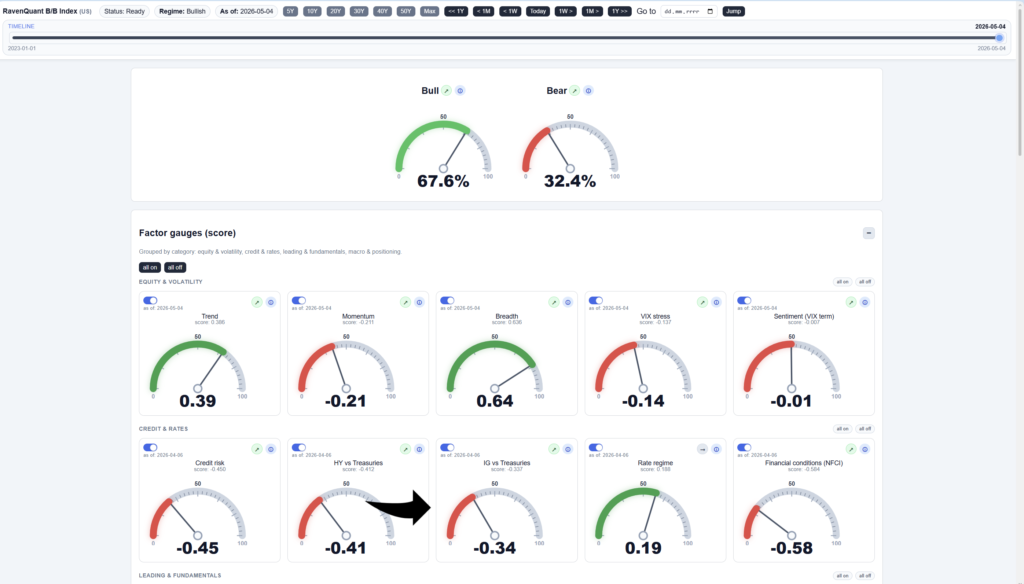
Live dashboard: RavenQuant B/B Index
Investment-Grade Spreads is a key market regime signal for investors. There is a version of credit market stress that sometimes flies under the radar because people associate credit blowups with junk bonds. High-yield spreads spike, the narrative goes — that means speculators are getting nervous. But investment-grade? That is the boring, stable part of the credit market. AAA and BBB companies. Blue chips. Surely that is not something to worry about.
This is exactly the kind of thinking that gets investors in trouble. When even investment-grade spreads widen meaningfully, it is a signal that something systemic is happening — not just sector-specific stress in energy or retail, but a broad repricing of corporate credit quality across the entire economy.
What Investment-Grade Spreads Reveal About Credit Risk Appetite
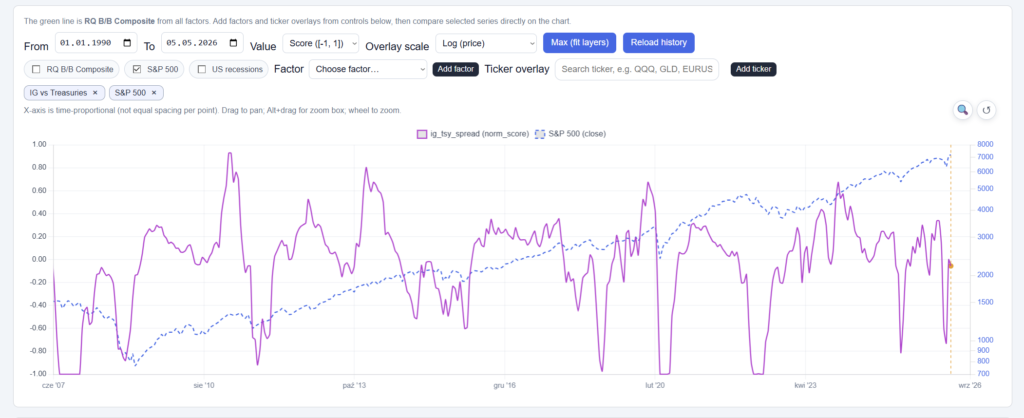
An investment-grade (IG) corporate bond spread is the extra yield that high-quality companies — those rated BBB or better by the major agencies — must pay above comparable U.S. Treasuries. If a 10-year Treasury yields 4.5% and a highly-rated corporation issues 10-year debt at 5.2%, the spread is 70 basis points (0.70%).
This spread represents the market’s collective pricing of corporate credit risk above the theoretical risk-free rate. In calm markets, IG spreads are narrow. Investors are comfortable taking corporate credit risk for a modest premium. In stressed markets, that premium widens — sometimes dramatically — because investors become uncertain about the economic outlook and demand more compensation for holding corporate paper instead of government bonds.
The FRED series BAMLC0A0CM — the ICE BofA US Corporate Index Option-Adjusted Spread — is the standard benchmark for tracking this. It is a broad index of investment-grade U.S. dollar corporate debt, and it gives a clean daily read on where IG credit stress is at any moment.
How to Read Tightening vs. Widening Spread Regimes
Most market observers focus on high-yield spreads when they want to read credit market sentiment. HY spreads are more volatile, more sensitive to risk appetite, and more immediately reactive to bad news. But they also have a known limitation: they can widen sharply simply because of concentration in energy or commodity-related debt, which was a significant issue in 2015–2016. That episode made HY spreads look terrifying while IG credit remained relatively calm, and the equity market eventually shrugged it off.
When IG spreads widen alongside HY spreads, that is a much more serious signal. Investment-grade companies — by definition — have stronger balance sheets, better access to capital markets, and more financial resilience. When the market demands a meaningfully higher premium to hold their debt, it means the stress has moved beyond the speculative fringe and into the core of the corporate world.
This distinction matters for how you interpret each signal: the HY-IG differential captures the risk appetite gap within the corporate bond market, while the IG-Treasury spread measures the absolute repricing of investment-grade credit relative to risk-free rates. You can have the former move without the latter — and that tells you something specific about where in the credit structure the stress is concentrated.
Historical IG Spread Blowouts
The clearest example of IG spread blowouts is 2008–2009. The ICE BofA IG spread, which had been running around 100–150 basis points in the years before the financial crisis, spiked to over 600 basis points at the peak of the crisis in late 2008 and early 2009. This was not a reflection of one sector struggling. It was the market saying that even investment-grade U.S. corporations carried substantial default risk — a level of systemic fear that had not been seen in generations.
March 2020 produced a shorter but sharp IG spread spike, as the COVID-19 shock froze credit markets across the board. The Federal Reserve’s unprecedented intervention — announcing it would buy investment-grade corporate bonds outright for the first time in its history — was specifically targeted at this: the IG credit market had seized up, and the Fed stepped in to force spreads tighter. That action illustrates how seriously policymakers take IG spread widening when it happens.
Reading Tightening vs. Widening Spread Regimes
One thing to understand about IG spreads relative to, say, equity prices: they do not move dramatically in short periods during normal market conditions. They are slow and sticky. This is actually useful — a sustained widening in IG spreads over weeks or months carries more signal than a single day’s equity volatility. But it also means this factor will not fire quickly in a fast-moving market episode.
The value of this indicator is most meaningful when it is moving persistently in one direction. A gradual but sustained widening over weeks is worth paying attention to even if it looks small in absolute basis points. Short-term daily noise in IG spreads is far less informative than the direction and velocity of the trend across a longer window.
IG spreads are slow by nature, and that speed means they will almost always confirm a deteriorating macro environment rather than lead it. In fast-moving crises — like the equity selloff in late 2018 or the initial COVID shock — IG spreads may widen only after equities have already repriced sharply. Their value is in identifying sustained, systematic credit stress, not sudden short-term dislocations. IG spreads also do not distinguish between a widening caused by genuine credit concern and one caused by technical factors like a surge in new corporate issuance temporarily cheapening the market. When spreads are widening in a heavy issuance period, some of the move may be supply-driven rather than a pure risk-off signal.
IG Spreads in RavenQuant B/B Index
The IG spread factor — using the BAMLC0A0CM series from FRED, updated daily — is one of the inputs in the RavenQuant B/B Index at ravenquant.com. If you want to see where investment-grade credit stress is scoring right now alongside other macro indicators, it is visible in the dashboard there.
Explore the live index here: https://bull-bear-analyzer-production.up.railway.app