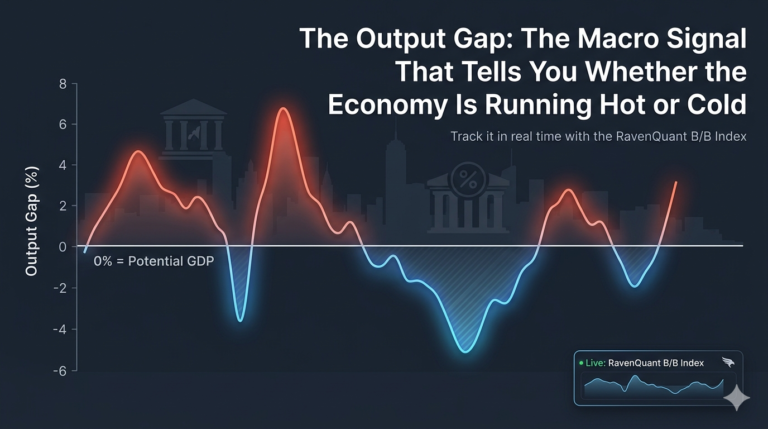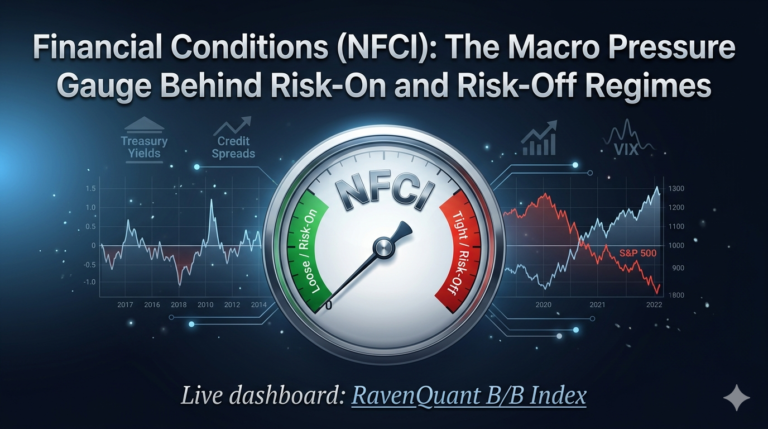
Live dashboard: RavenQuant B/B Index
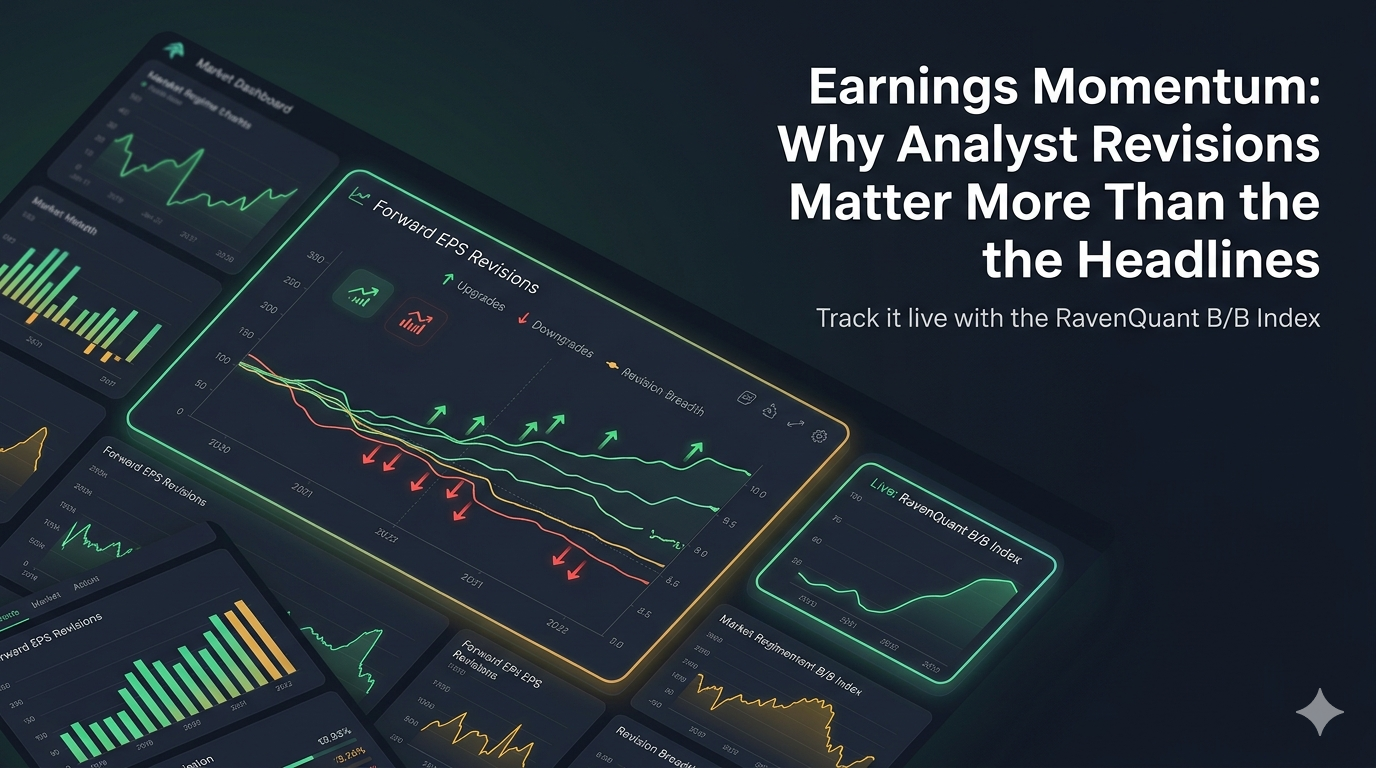
Earnings season gets treated like a sporting event — beats and misses, winners and losers, stock reactions measured in percentage points. But the more useful signal isn’t whether a company beat the consensus estimate by two cents. It’s the direction that estimates themselves are moving before the report hits. That’s what earnings momentum is about: are analysts marking their forward estimates up or down, and is that revision trend broad enough across the market to mean something?
Earnings momentum, in its most practical form, tracks forward EPS revisions: when a broad consensus of analysts is revising next-twelve-months earnings per share higher, it’s a signal that the underlying business environment is getting better — demand is holding up, margins are expanding, or guidance from companies themselves is improving. When revisions are coming down across the board, it’s a warning signal, regardless of where stock prices happen to be sitting at that moment.
Why Revision Breadth Matters More Than Earnings Headlines
One of the underappreciated features of earnings revisions is that they tend to be sticky and self-reinforcing. When analysts at major banks start upgrading their EPS estimates for the S&P 500, others follow. This isn’t purely herding — it often reflects genuine new information. A company that beats estimates in January and raises guidance typically causes analysts to revise estimates upward not just for that company but for its peers and suppliers. The positive signal propagates through the system.
The same works in reverse, and it works faster. Negative earnings revisions cluster even more tightly than positive ones, partly because analysts are reluctant to cut estimates until the evidence is overwhelming. By the time a broad downgrade cycle is underway, the fundamental deterioration is usually well established. That’s why falling earnings momentum is such a meaningful bearish signal — it means the fundamental backdrop has genuinely shifted, not just sentiment.
How to Read Upgrades, Downgrades, and Trend Confirmation
The most dramatic modern earnings collapse came in 2008 and 2009. S&P 500 operating earnings fell approximately 45% from peak to trough. That wasn’t a rounding error or a statistical artifact — it was a genuine destruction of corporate profitability driven by the financial crisis, credit contraction, and the deepest recession since the Great Depression. What made it particularly dangerous from a market perspective was that the earnings collapse and the valuation multiple compression happened simultaneously, compounding losses.
The recovery in earnings momentum actually preceded the market bottom. Analysts began revising estimates higher for Q3 2009 before the stock market had fully recovered, which is consistent with earnings momentum being a leading indicator of fundamental improvement rather than a coincident one. Investors who tracked revision breadth — how many analysts were revising up versus down — got an early signal that the worst was behind the cycle.
2022 Case Study: Solid Earnings, Falling Multiples
The 2022 bear market told a different story. Earnings themselves held up reasonably well for much of the year — corporate profits were still elevated from the post-COVID demand surge, energy sector earnings were booming, and the labor market was still strong. The market sold off heavily anyway, because rising interest rates compressed valuation multiples. The price-to-earnings ratio fell sharply even as the “E” remained relatively stable.
This is an important nuance. Earnings momentum being positive doesn’t guarantee a bull market — other factors in the macro regime, like interest rate trends and liquidity conditions, can overwhelm positive earnings fundamentals. But when earnings momentum turns genuinely negative, it tends to validate a bearish macro call across multiple dimensions simultaneously.
For institutional investors, earnings revision data comes from IBES (Institutional Brokers’ Estimate System, now owned by Refinitiv/LSEG) and Bloomberg terminals that track analyst estimate changes in real time. Those aren’t cheap. For everyone else, FactSet’s weekly Earnings Insight report is the single best free resource available. Published every Friday during earnings season, it covers S&P 500 EPS growth rates, revision trends, beat rates, guidance data, and sector-level breakdowns.
FactSet’s reports are genuinely useful — not marketing material dressed up as research. They show, for instance, that the S&P 500 reported double-digit year-over-year earnings growth for five consecutive quarters through Q4 2025, with blended earnings growth of approximately 13% for Q4 2025. That’s the kind of concrete earnings backdrop data that feeds a momentum signal.
There’s a secondary reason earnings momentum matters beyond pure fundamentals: the earnings yield comparison. The earnings yield (forward EPS divided by price) is the inverse of the P/E ratio, and it’s directly comparable to the 10-year Treasury yield. When earnings are growing and the earnings yield is above Treasury yields, equities look attractive on a relative basis. When earnings are falling and yields are rising simultaneously — which is roughly what happened in 2022 — equities face headwinds from two directions at once.
The earnings momentum signal captures the directional trend of this fundamental story: which way are estimates moving, and are they moving with enough persistence to matter?
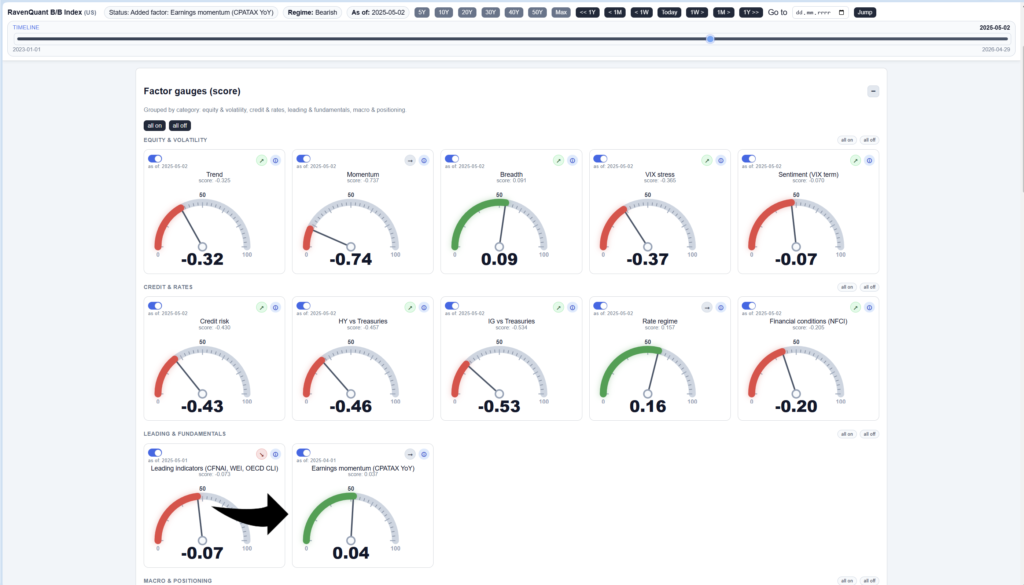
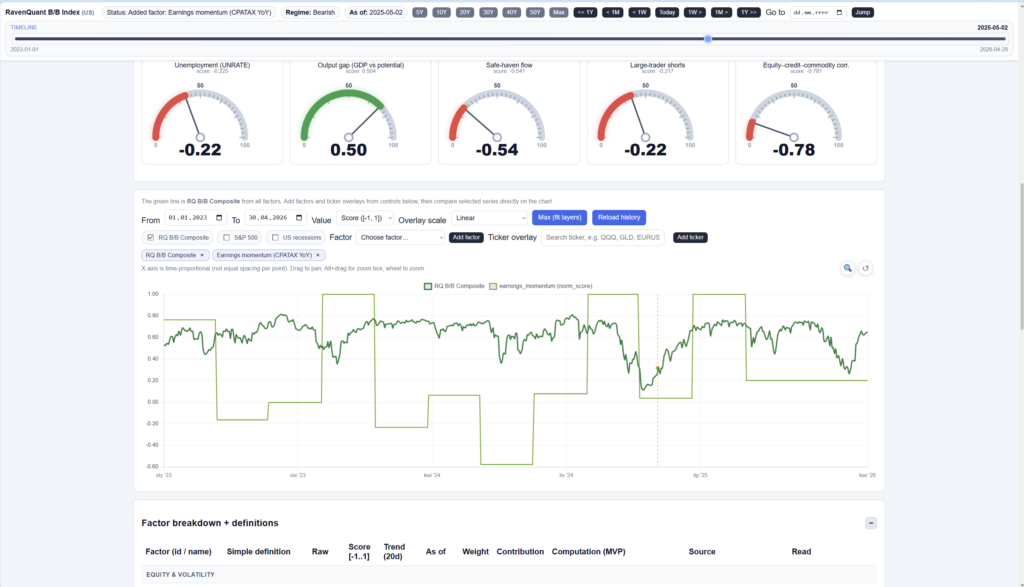
How RavenQuant Integrates Earnings Momentum in Real Life
In the live RavenQuant B/B Index, earnings momentum is integrated as a breadth-and-direction regime signal: the model tracks whether forward EPS revisions are broadly improving or deteriorating across key sectors, not just whether one quarter beats estimates. Persistent upgrade breadth increases the fundamental support score for risk assets, while broad downgrade waves reduce that score and raise downside-risk weighting. This keeps portfolio stance tied to the real revision trend that usually leads headline earnings reactions.
Forward EPS estimates are analyst guesses. Full stop. They can be wrong by substantial margins, particularly around economic turning points when the visibility into future revenues and margins is lowest. Estimates are also quarterly data with a lag — by the time a company reports, the market has often already discounted the known information. What matters for the momentum signal is the revision trajectory leading into and following reports, not any single data point.
For independent verification, FactSet’s Earnings Insight is the best publicly available source. Published weekly, it gives you everything you need to understand whether earnings momentum is strengthening or fading in the current cycle — no Bloomberg terminal required.
Explore the live index here: https://bull-bear-analyzer-production.up.railway.app