Every investor, at some point, has stared at their portfolio during a brutal selloff and asked the same question: Was I supposed to see this coming? Not in the sense of predicting the exact day or the exact percentage — nobody does that reliably — but in the broader sense. Was there a signal? Was the market already telling the story, and I just wasn’t listening?
That’s the question the RavenQuant Bull/Bear Index (Bull Bear Index) is built to answer.
Why Single Indicators Keep Letting You Down
Most retail investors eventually gravitate toward a handful of go-to signals. The 200-day moving average is the classic one — when the S&P 500 is above it, you’re in; when it’s below, you’re out. Simple, clean, backtestable. And it works, until it doesn’t. The problem is that a moving average is a lagging indicator by design. By the time price has broken below the 200-day, you’ve already absorbed a meaningful drawdown. And in choppy sideways markets, you get whipsawed in and out multiple times, generating friction and transaction costs while going nowhere.
So you might add the VIX. Spike above 30, and you start getting defensive. But the VIX is mean-reverting and famously spiky — it can scream danger during a brief liquidity hiccup that turns out to be a buying opportunity, and it can stay suspiciously calm right up until a market breaks. Think about how quietly the VIX behaved through much of 2007 even as the mortgage market was deteriorating.
Credit spreads? Useful. A widening high-yield spread has historically preceded equity weakness. But there’s noise there too, and timing is genuinely difficult. Rate regimes? The yield curve has inverted before recessions, but the lag between inversion and actual market peak has ranged from a few months to nearly two years. By the time the signal fires and then resolves, you’re either late or you’ve been sitting in cash for 18 months watching the market melt up.
The core problem isn’t any single indicator — it’s relying on any single indicator at all. Markets don’t move because of one thing. They move because of the accumulated weight of many things, and the most dangerous environments are the ones where multiple factors line up in the same direction at the same time.
What the RQ B/B Index Actually Is
The RavenQuant Bull/Bear Index — the RQ B/B Index — is a quantitative regime detection model. Its job isn’t to predict where the market will be in three months. It’s to assess, right now, whether the current environment looks more like the conditions that historically accompany bull markets or the conditions that historically accompany bear markets.
The distinction matters. A regime model isn’t saying “the market will go up next week.” It’s saying “the balance of evidence currently looks bullish” — or bearish, or genuinely ambiguous. That’s a meaningfully different and, arguably, more honest framing.
The model combines 17 separate factors drawn from macroeconomic data, market technicals, and sentiment signals. Each factor is normalized, weighted, and combined into a single composite score. That score is then passed through a sigmoid function to produce a probability — specifically, the probability that the current market is in a bull regime. The complement, 1 minus that probability, is the bear probability.
The output is expressed as a clean probability between 0% and 100%. When P(Bull) hits 65% or above, the model signals a bullish regime. When it falls to 35% or below, it signals a bearish regime. Everything in between is a neutral or transitional zone — which is an honest acknowledgment that markets spend a lot of time in ambiguous territory.
The live RavenQuant bull bear market index dashboard is available here → [link].
How the Math Actually Works (Without the Math)
The weighted average of normalized factor scores produces what the model calls a “sentiment score” — though that word shouldn’t mislead you. It’s not a survey of investor feelings. It’s a composite of fundamental, technical, and positioning data that collectively describes the market’s underlying health.
Once you have that composite score, you need to convert it into a probability. That’s where the sigmoid function comes in. If you’ve ever seen an S-shaped curve, you’ve seen a sigmoid. It takes any real number and maps it to a value between 0 and 1. When the composite score is strongly positive, the sigmoid output approaches 1 (high bull probability). When it’s strongly negative, it approaches 0 (high bear probability). When it’s near zero — when the evidence is genuinely mixed — the sigmoid returns something close to 50%, reflecting that uncertainty rather than forcing a false conviction.
The regime thresholds at 35% and 65% create a neutral zone that you might initially find frustrating. Isn’t the point to give you a clear signal? But this is actually one of the better design choices in the model. A lot of market time is genuinely ambiguous — the late-cycle period when the economy is slowing but hasn’t broken, or the early-recovery period when data is still messy but leading indicators have started to turn. Forcing those environments into a binary bull/bear call would create a lot of false signals. The neutral zone lets the model say “we don’t have strong evidence either way” without pretending otherwise.
The Four Pillars of the Model
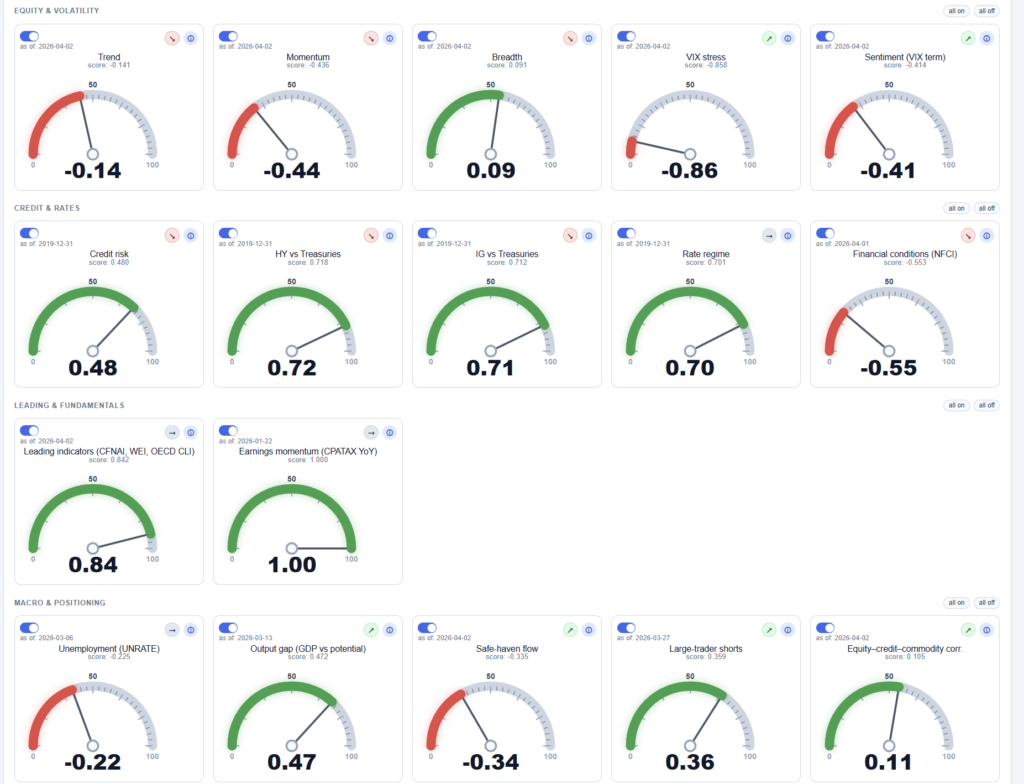
The 17 factors are organized into four categories, and it’s worth understanding what each one is trying to capture — because together, they’re mapping four very different dimensions of market reality.
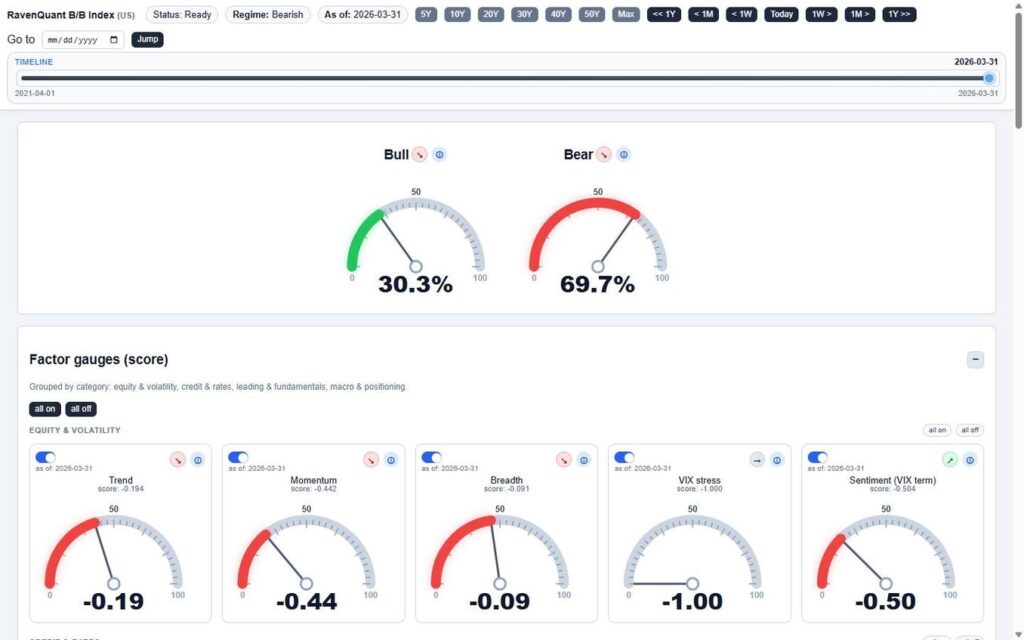
Equity and Volatility
This is the most market-facing pillar, and it carries the heaviest weight in the model. Price trend relative to the 50-day and 200-day moving averages (16% of the total) tells you what the market has actually done. Breadth — specifically what share of sector ETFs are trading above their 200-day moving averages (10%) — tells you whether that trend is broad-based or just being driven by a handful of mega-caps masking weakness underneath. The VIX (12%) captures implied volatility and stress pricing. Momentum (9%) looks at six- and twelve-month returns scaled by three-month volatility, which adjusts raw performance for how turbulent the ride has been. And the VIX term structure — specifically the ratio of VIX3M to spot VIX — adds a sentiment texture: when short-term fear is elevated relative to medium-term expectations, the market is pricing in near-term panic.
Together, these factors answer the question: what is the market actually doing right now, and how healthy does that action look beneath the surface?
Credit and Rates
Credit markets often move before equity markets. When high-yield spreads start widening relative to investment-grade spreads, it means the market is becoming more discriminating about credit risk — a classic early-warning sign. The model tracks the HY-IG OAS spread (10%), the outright level of high-yield spreads (3%), and investment-grade spreads (2%), giving you a layered picture of where credit stress is building.
Rate regime (8%) captures the slope of the yield curve and the level of real 10-year yields, which together describe whether monetary conditions are tightening or easing. Financial conditions (4%) come from the Chicago Fed’s National Financial Conditions Index — a broad composite of money market, debt market, and equity market conditions that’s been a reliable real-time gauge of liquidity stress.
Why does this matter for equity investors? Because equities and credit are both claims on corporate cash flows. When bond markets start pricing in elevated default risk, equity markets usually follow — they just tend to be slower to react.
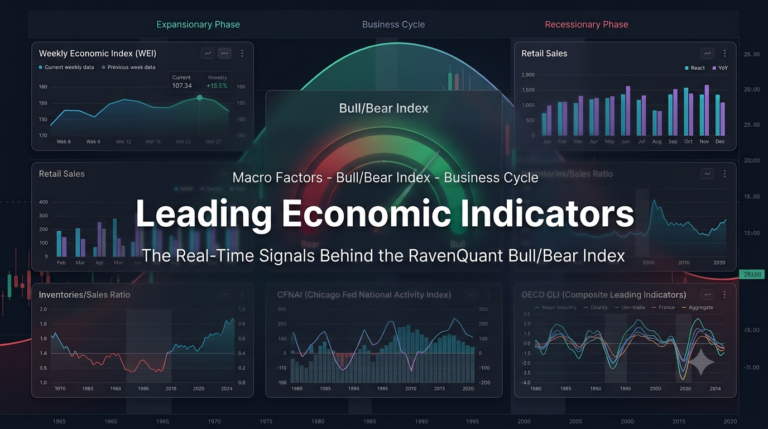
Leading and Fundamentals
This is where the model roots itself in the real economy rather than just market prices. The leading indicators component (5%) pulls from the Chicago Fed National Activity Index (CFNAI), the New York Fed’s Weekly Economic Index, and the OECD’s Composite Leading Indicator — three separate attempts to capture where the economy is heading rather than where it’s been.
Earnings momentum (4%) tracks year-over-year changes in corporate profits after tax using CPATAX data from FRED, which is a more fundamental measure than analyst EPS estimates (which are famously optimistic). The output gap (3%) — real GDP versus the CBO’s estimate of potential GDP — tells you whether the economy is running hot, cold, or somewhere in between. And unemployment (2%), while a lagging indicator by nature, provides a ballast: it’s slow to move but meaningful when it does.
The explicit inclusion of these macro-fundamental factors is what separates a regime model from a pure momentum system. A momentum-only model would have been fully invested in late 2021 — because prices were still going up — even as the leading indicators were rolling over and the real yield was about to turn sharply positive.
Macro and Positioning
The final pillar covers three factors that are harder to categorize but genuinely useful at extremes. Safe-haven flow (6%) compares the three-month relative performance of SPY versus gold (GLD) and the dollar (UUP). When capital is rotating heavily into gold and the dollar at the expense of equities, it’s a real-time signal of risk aversion that doesn’t wait for monthly surveys or lagged economic data.
The short whale factor (2%) uses CFTC Traders in Financial Futures data to construct a proxy for large-trader net short positioning. Extreme positioning data is a sentiment measure of a different kind — it tells you what sophisticated institutional participants are actually doing with their capital rather than what they’re saying publicly.
Finally, equity-credit-commodity correlation stress (1%) tracks whether correlations between these asset classes are behaving unusually. During genuine market dislocations, correlations tend to spike as everything moves together — a quantifiable sign that the market is in a risk-off, flight-to-safety mode.
Why the Design Choices Matter

Two architectural decisions in the RQ B/B Index are worth thinking about carefully, because they reflect a genuine philosophy about how to handle noisy, incomplete data.
The first is what happens when a factor is missing or unavailable. The model excludes it from the weighted average rather than treating it as neutral (zero). This sounds like a small technical detail, but it has a real consequence: the composite score isn’t diluted by data gaps. If you filled in missing factors with zeros, you’d effectively be saying “this factor is giving us a neutral signal” — which is a form of fabrication. Excluding the factor and renormalizing the remaining weights is more honest. The model’s confidence scales with the data it actually has.
The second choice is the number of factors: 17. Why not 5? Why not 50? Five factors would be simpler and more interpretable, but you’d be leaving a lot of signal on the table — each individual factor is noisy, and the diversification across 17 largely independent measures smooths out a lot of that noise. Fifty factors, on the other hand, would create multicollinearity problems (many would be measuring the same underlying thing), overfit to historical data, and become impossible to monitor or explain. Seventeen is a deliberate middle ground.
The four-category structure is also meaningful. By grouping factors into Equity & Volatility, Credit & Rates, Leading & Fundamentals, and Macro & Positioning, you can examine where conviction is coming from. A 70% bull probability built on strong equity and momentum signals but weak credit and leading indicator support is a very different animal from a 70% bull probability where all four pillars are pointing in the same direction.
What a 70% Bull Probability Actually Means

This is where people sometimes get confused, and it’s worth addressing directly. A 70% bull probability is not a prediction that the market will be higher in six months. It’s saying that the current configuration of 17 factors looks more like the historical conditions that accompanied bull markets than bear markets, and the model is 70% confident in that classification.
Regime signals are most actionable at the extremes. A reading of 80% or higher, sustained over multiple weeks, is a strong signal that conditions are genuinely favorable. A reading of 20% or lower, similarly sustained, is a serious warning. It’s in the 40-60% range where the model is essentially telling you that the evidence is genuinely mixed, and you should manage risk accordingly rather than making confident directional bets.
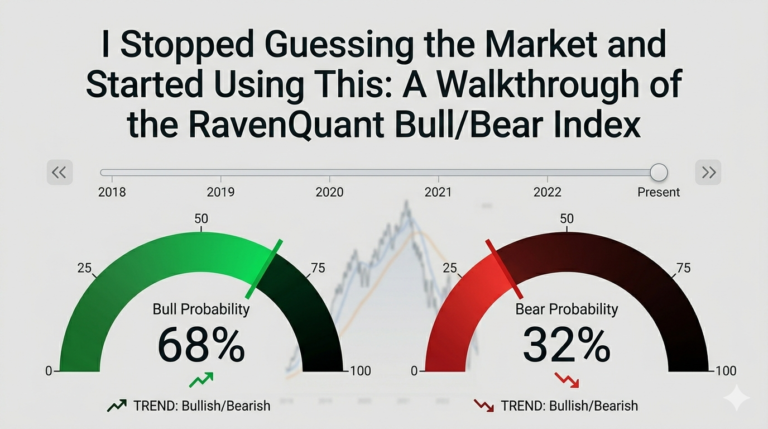
The model is best used as a risk-management tool rather than a precise timing mechanism. If you’re sitting at 68% bull probability and your portfolio is defensively positioned, that’s worth reflecting on. If you’re at 30% and fully invested in high-beta equities, that’s also worth reflecting on — not as a signal to panic-sell, but as a prompt to examine whether your position sizing is appropriate for the environment the model is describing.
Regime changes also don’t happen overnight. The model is designed to detect sustained shifts in market conditions, not daily fluctuations. A one-day spike in the VIX won’t move the composite score much, because the VIX factor is one of 17, and many of the other factors — leading indicators, credit spreads, the output gap — are slow-moving by design. That’s a feature. Regime detection should be stable, not reactive to every piece of intraday news.
Beyond the current snapshot, the model also tracks the 20-day trend direction for each individual factor — whether it’s been improving or deteriorating over the past month. A credit spread score sitting at -0.4 tells you something, but knowing that it’s been drifting worse for three weeks tells you something different. Directional momentum within a factor is often an earlier signal than the level itself — the score confirms where things are, the trend hints at where they’re going.
Check today’s bull bear market index reading and history → [link].
Where This Fits in Your Toolkit
No model tells you the whole story. The RQ B/B Index doesn’t know about company-specific news, geopolitical shocks, central bank policy surprises, or the kind of reflexive feedback loops that can take a minor credit stress event and turn it into a systemic crisis in a matter of weeks. It’s backward-looking in the sense that it’s reading current data, not predicting the future, and the data itself has lags — some of these series update monthly, others weekly, a few in real time.
What it does well is synthesize a broad, multi-dimensional picture of market conditions into a single, interpretable number. It forces discipline. It makes you look at credit markets when you’re only watching equities. It keeps leading indicators in the frame when it’s tempting to anchor only on what the stock market has done recently. It incorporates positioning data so you’re not flying blind on what institutional participants are actually doing.
Think of it as a cockpit instrument rather than an autopilot. A pilot doesn’t stare at the altimeter and ignore the airspeed indicator, and they don’t let one instrument override all the others when there are conflicting readings. The RQ B/B Index is the composite readout — the instrument panel condensed into a single dial — that tells you, right now, whether the weight of evidence says you’re flying through clear air or heading into weather. What you do with that information is still your decision.
And honestly, that’s the right way to use any model.
If you want this cockpit instrument on your desk, you can use the RavenQuant bull bear market index tool here → [link].
Data sources include Yahoo Finance and the Federal Reserve Economic Data (FRED) database, BLS, CFTC, Chicago Fed, NY Fed, and OECD.