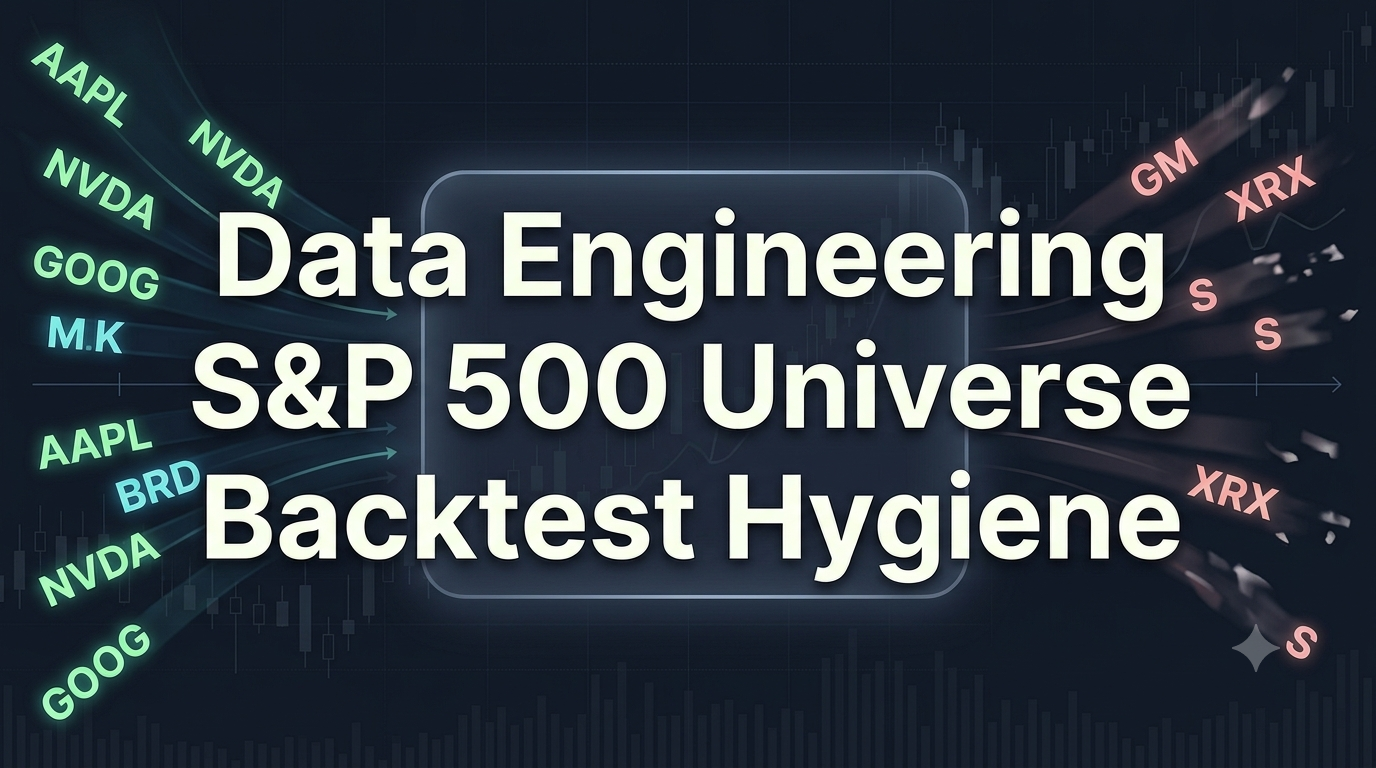
I see the same shortcut over and over. Someone wants to backtest an S&P 500 idea, so they scrape today’s list of 500 tickers from Wikipedia, download prices from Yahoo Finance, and call it a day. That feels clean. It is also the wrong universe for almost any historical question. If your study covers 2005, 2015, or even last year, you need historical S&P 500 constituents, meaning the companies that were actually in the index on each date, plus the additions and removals that reshaped the membership along the way.
This article is about that data problem, not about selling you a signal. I will walk through why the current list quietly inflates results, what a usable membership history looks like, the main ways to get that history, and the messy details that break naive scrapers. The easiest path for most people is the RavenQuant ATH Scanner workbook autobuild. The concept still comes first: you need point-in-time membership, not today’s roster pasted onto the past.
Membership
Point-in-time
Who was in the index on date T
Main Bias
Survivorship
Today’s winners applied to the past
Wiki Depth
~2020+
Useful revision history is recent
Goal File
Intervals
Ticker, start date, end date
Why today’s S&P 500 list is the wrong historical universe
The S&P 500 is not a fixed club. Companies get added when they grow into the index and get removed after mergers, spin-offs, bankruptcies, or when they shrink out of eligibility. Roughly speaking, a large share of today’s names were not members a decade ago. If you take the current roster and pretend those stocks were investable S&P 500 names in 2010, you are stuffing the past with future winners.
That is survivorship bias in its plainest form. The companies that made it into today’s index tend to have had stronger historical paths than the companies that got kicked out, acquired at a discount, or simply never made the cut. Robot Wealth and other quant educators have shown this directly: mean returns for current constituents look much stronger if you include the years before those stocks joined the index. Your strategy then looks smarter than it was, because the universe was quietly curated by later success.
This is why our own research notes often call out universe construction explicitly. In the Nasdaq 100 momentum study, for example, we used current Wikipedia constituents and said so up front, because that choice has survivorship bias. Honesty about the universe is part of the result. If you want cleaner S&P 500 history, you need a better membership file before you argue about alpha.
What a usable file of historical S&P 500 constituents looks like
People often ask for “the historical list,” as if it were one spreadsheet with 500 rows. What you actually want is a membership history. The cleanest practical structure is an interval table:
| Field | Why you need it |
|---|---|
| ticker | The trading symbol used to fetch prices. Unstable over long horizons. |
| company name | Human check against ticker renames and mergers. |
| CIK or permanent ID | Stable identity when tickers change. Wikipedia added CIK later, so coverage is uneven before the mid-2010s. |
| start_date | First date the name belongs in your point-in-time universe. |
| end_date | First date it no longer belongs. Leave open or use a far-future date for current members. |
| event reason | Optional but useful: addition, removal, acquisition, spin-off, bankruptcy. |
Once you have intervals, generating a monthly snapshot is easy. For each month-end T, take every row where start_date <= T < end_date. That snapshot is your investable S&P 500 universe on that date. From there you can join prices, fundamentals, dividends, or signals without pretending every survivor was always a member.
For event studies, keep the raw addition and removal calendar too. That is what we used in the S&P 500 index addition strategy analysis: not a frozen roster, but a sequence of membership events with effective dates. The membership intervals and the event calendar are two views of the same history.
Four ways to build historical S&P 500 constituents
1. Use RavenQuant ATH Scanner (easiest)
If you want the workbook without maintaining scrapers, start here. The RavenQuant ATH Scanner can autobuild an S&P 500 historical constituents workbook and pull pricing data in one desktop workflow. Under the hood it still leans on Wikipedia for membership history and Yahoo Finance for prices. You get a reviewable file instead of a pile of ad hoc scripts. That is the easiest practical solution for most retail and independent research. Details of the in-app steps are below.
2. Walk backward from today’s list using the Wikipedia changes table
The Wikipedia page List of S&P 500 companies has two useful pieces: the current constituents table and a “selected changes” table with additions and removals. A common free method is:
- Download the current constituents.
- Parse the changes table into dated add/remove events.
- Start from today and walk backward month by month.
- When a stock was added on date D, remove it from all earlier snapshots.
- When a stock was removed on date D, put it back into earlier snapshots.
This is understandable for DIY work. The catch is completeness. The changes table is “selected,” not a perfect institutional audit trail. Coverage gets thinner and noisier the further back you go. Treat it as a public reconstruction, not as official S&P Dow Jones history.
3. Pull Wikipedia page revisions for point-in-time snapshots
Another free approach is Wikipedia’s revision history. Because the constituents page is edited as the index changes, an old revision is roughly a snapshot of what the community believed the membership was at that time. Using the MediaWiki API, you can:
- Ask for the revision nearest to each month-end.
- Download that revision’s HTML or wikitext.
- Parse the constituents table into a monthly roster.
- Diff consecutive months to recover additions and removals.
In practice, useful Wikipedia revision history for this page only reaches back to about 2020. Before that, the revision trail is too thin or too messy to rebuild a clean monthly roster the same way. So this method helps for recent point-in-time work. It does not give you a multi-decade membership file on its own.
4. Buy or license institutional membership data
If you need production-quality point-in-time history, paid sources still win. Morningstar, Compustat, and similar databases maintain curated membership with better corporate-action handling. That is the right answer for fund research, academic publication standards, or any process where a Wikipedia typo is unacceptable. The free methods and ATH Scanner are for learning, prototyping, and transparent retail research. Know which standard you are aiming for before you start coding.
The messy details that break naive lists
Getting 500 tickers onto a page is the easy part. Making that list usable for multi-year research is where most DIY projects stall.
Identity problems
Ticker changes: FB became META. A membership file that stores only the latest ticker will miss older price series unless you map aliases.
Mergers and acquisitions: A removed name may continue economically inside an acquirer. Your backtest needs a rule for cash exits, stock swaps, or dropping the name.
Share-class and dual listings: Some index memberships involve specific share classes. Mixing them up creates silent price errors.
Data join problems
Delistings: Removed names often have short or messy Yahoo histories. Decide whether missing prices mean “skip,” “use last trade,” or “treat as forced exit.”
Effective dates vs announcement dates: Index studies can look very different if you enter on announcement day instead of effective inclusion day.
Revisions: Public pages get corrected later. Rebuilds of the same history will not always match bit for bit.
My working rule is simple. Store both a display ticker and the best permanent ID you can get. Keep event dates explicit. Log every name you could not price. If 8% of historical members have no usable price history, that belongs in the methodology note, not in a silent drop. The S&P 500 dividend stocks study is a good example of that discipline: the historical workbook and the exact classification rules were part of the claim, not an afterthought.
A practical workflow you can actually maintain
If you are building this yourself, aim for a boring, repeatable pipeline:
- Ingest membership source: ATH Scanner autobuild, Wikipedia revision snapshots (roughly 2020+), changes table, or licensed Morningstar data.
- Normalize identity: upper-case tickers, strip dots/hyphen quirks carefully, attach CIK when available.
- Build intervals: one row per membership spell, with start and end dates.
- Validate: monthly count near 500, no overlapping intervals for the same ID, no empty tickers.
- Join prices: only for names that were members on that date.
- Export research panels: monthly universes, event calendars, and a data-quality log.
Do not optimize strategy parameters until that pipeline is stable. Otherwise you will “improve” a backtest by changing universe bugs. I have done enough of these studies to say this bluntly: a mediocre strategy on a clean universe is more informative than a beautiful equity curve on a contaminated one.
How to use RavenQuant ATH Scanner for historical S&P 500 constituents
Among the options above, ATH Scanner is the easiest one for most people who just want a usable research file. The RavenQuant ATH Scanner is built around S&P 500 research workflows. The first job it solves is universe construction: build or load a workbook with historical constituents and pricing data, then use that workbook for scanning or backtesting.
Here is how that workflow looks in practice:
1. Build the historical workbook in-app
Use the autobuild path to assemble an S&P 500 constituents snapshot/history and pull pricing data. The app relies mainly on Wikipedia for constituents/history and Yahoo Finance for prices. That matches the free public-source approach described above, packaged into a desktop workflow so you are not hand-stitching CSV files. Remember the Wikipedia depth limit: useful revision history for this page is roughly from 2020 onward, and the source itself can omit or misstate events.
2. Or load a workbook you already trust
If you already built membership intervals yourself, or you received a ready workbook, load it instead of rebuilding. Best practice is to generate a short workbook first so you can see the required sheet structure, then map your own file to that template.
3. Inspect before you research
Once the workbook exists, check the obvious things: date coverage, whether removed names appear in earlier periods, and whether price history is present for the names you care about. The point of a workbook is not magic. It is a reviewable artifact.
4. Reuse the same universe for signals or backtests
After the membership and price panels are in place, ATH Scanner can scan ATH-streak setups for a selected buy month or, in the Full edition, backtest month ranges against SPY. The important sequencing is universe first, strategy second. That is the same order you should use even if you never open the scanner’s signal mode.
In other words, use the scanner when you want the easiest path to an inspectable S&P 500 historical workbook and a path into systematic tests like the ATH momentum framework from our S&P 500 momentum article. Do not use it as a shortcut past understanding what the membership file represents.
DIY versus a workbook tool: which path fits?
| Situation | Better fit |
|---|---|
| You want the easiest path to a reviewable research workbook | ATH Scanner autobuild (easiest) |
| You want to learn the data model and control every parse rule | DIY Wikipedia / API pipeline (revision history ~2020+) |
| You publish institutional work or manage client capital | Licensed Morningstar / Compustat-style point-in-time data |
| You only need current members for a live screen today | Current Wikipedia or ETF holdings list is fine |
| You are studying additions/removals as events | Event calendar with effective dates, not only monthly snapshots |
Notice the last row. Historical constituents and index-event studies are related but not identical. A monthly membership snapshot answers “who was in the index on this date.” An additions calendar answers “what changed, and when did it become effective.” Many good projects need both.
The honest verdict on historical S&P 500 constituents
If you take one thing from this article, take this: strategy code is not where most retail backtests go wrong. Universe construction is. Using today’s S&P 500 members as if they were the historical index is convenient, popular, and quietly distorting. Build point-in-time membership first. Validate it. Only then ask whether a signal has edge.
You can rebuild historical S&P 500 constituents yourself from Wikipedia changes or revision history, knowing useful Wikipedia history for this page only goes back to about 2020 and that Wikipedia entries are not fully correct. There may be omissions and errors. Even so, that list is usually a good tradeoff: it still lets you produce a fairer analysis base than a current-roster backtest. You can buy cleaner institutional data from Morningstar or peers. Or take the easiest path and use the workbook workflow in RavenQuant ATH Scanner, with those same public-source caveats attached. The respectable move is not pretending any option is perfect. The respectable move is choosing the method that matches your standard of evidence, then documenting it.
FAQ: historical S&P 500 constituents
Why can’t I use today’s S&P 500 list for a historical backtest?
Because today’s members are not the historical index. Many current names joined later, and many past members left after mergers, shrinks, or bankruptcies. Pasting the current roster onto older years quietly keeps survivors and drops failures.
What are historical S&P 500 constituents?
They are the companies that belonged to the S&P 500 on each past date, usually stored as membership intervals (ticker or ID, start date, end date) or as month-end snapshots. That point-in-time file is what a fair index backtest needs.
How do you rebuild S&P 500 membership over time from Wikipedia?
Two common DIY paths: walk backward from today’s list using the selected changes table, or pull old page revisions and parse each month’s constituents table. The easiest packaged path is the RavenQuant ATH Scanner autobuild, which uses the same public sources.
How far back does Wikipedia S&P 500 history go?
Useful Wikipedia revision history for the constituents page only reaches back to about 2020. Before that, the revision trail is too thin or too messy for a clean monthly rebuild the same way.
What is survivorship bias in index backtests?
It is the distortion you get when the universe is filtered by later success. Using only names that survived into today’s S&P 500 makes historical returns look better than an investor could have earned from the live index membership at the time.
Can RavenQuant ATH Scanner build a historical S&P 500 workbook?
Yes. Autobuild assembles a constituents history workbook and pulls pricing data, mainly from Wikipedia and Yahoo Finance. You can also load a workbook you already trust. Review date coverage and missing prices before you research.
Is Wikipedia accurate enough for historical S&P 500 constituents?
Not fully. There can be omissions, delayed edits, ticker mistakes, and later corrections. For many research projects it is still a good tradeoff: even an imperfect historical list is a fairer analysis base than today’s 500 names pasted onto the past. For audit-grade work, use licensed Morningstar or similar data.