S&P 500 Contrarian Strategy — Intro
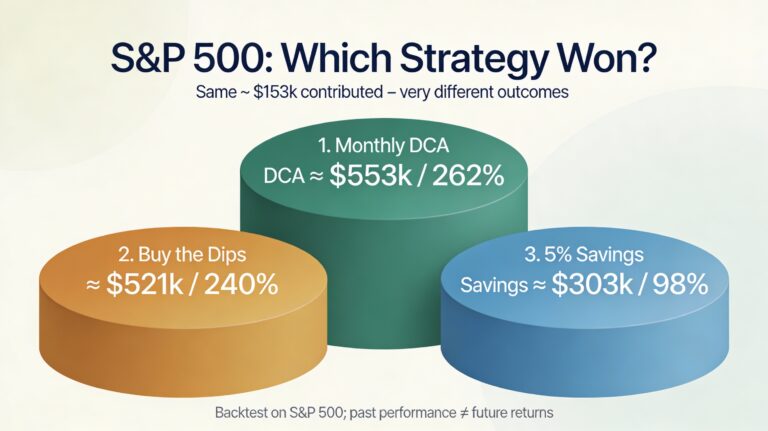
What happens after a stock experiences an unusually large one-day move? Does momentum continue… or does the market overreact and create a short-term reversal opportunity?
This quantitative research project tested a simple but surprisingly powerful contrarian concept across more than two decades of S&P 500 market history. The results suggest that extreme moves frequently create statistically meaningful mean-reversion opportunities — especially when combined with disciplined execution and controlled risk.
The strategy showed persistent long-term profitability across multiple parameter sets and randomized stock universes, suggesting that this is not merely curve fitting or a lucky historical anomaly.
20
Parameter combinations tested
503
S&P 500 stocks analyzed
2000–2026
Historical test period
$10k
Initial capital
How the Strategy Works
The logic is intentionally simple. After an exceptionally strong up day, the strategy opens a short position on the next market open. After an exceptionally large down day, it opens a long position.
The underlying assumption is that short-term market behavior often overshoots due to fear, forced positioning, emotional trading, and liquidity imbalances. As a result, a portion of these extreme moves tends to revert over the following trading sessions.

| Rule | Implementation | Why It Matters |
|---|---|---|
| Signal trigger | Daily move exceeds threshold | Captures emotional market extremes |
| Direction | Up move → short, down move → long | Pure mean-reversion logic |
| Entry timing | Next session open (D+1) | Avoids look-ahead bias |
| Position sizing | Single active position | Realistic capital allocation |
| Exit logic | Time-based exit or stop-loss | Controls downside risk |
| Capital release | Capital unlocked after exit | Prevents unrealistic overlapping exposure |
Full 20-Combination Backtest Results
One of the strongest findings from the study was the dominance of the 15% threshold region. These setups consistently outperformed lower-threshold systems in terms of both long-term growth and robustness.
Interestingly, more trades did not automatically produce better performance. Lower thresholds generated significantly higher turnover but also dramatically larger drawdowns.
| Combination | Threshold | Hold | Runs | Median CAGR % | Median Max DD % | Median Trades |
|---|---|---|---|---|---|---|
| 15% / 7d / 1% | 15% | 7 days | 15 | 17.58% | -58.50% | 955 |
| 15% / 5d / 1% | 15% | 5 days | 15 | 16.65% | -48.78% | 995 |
| 15% / 3d / 1% | 15% | 3 days | 15 | 15.73% | -53.75% | 1068 |
| 10% / 3d / 1% | 10% | 3 days | 15 | 15.20% | -72.61% | 2142 |
| 20% / 7d / 1% | 20% | 7 days | 15 | 11.77% | -48.59% | 481 |
| 5% / 3d / 1% | 5% | 3 days | 15 | 11.44% | -73.79% | 3547 |
| 15% / 10d / 1% | 15% | 10 days | 15 | 11.39% | -55.89% | 892 |
| 20% / 3d / 1% | 20% | 3 days | 15 | 11.32% | -41.04% | 511 |
| 20% / 5d / 1% | 20% | 5 days | 15 | 11.27% | -46.15% | 505 |
| 25% / 7d / 1% | 25% | 7 days | 15 | 9.70% | -35.09% | 278 |
Multiple parameter sets remained profitable over more than two decades of historical data. That is exactly what systematic traders want to see — not a single optimized setting, but an entire profitable region.
Robustness Testing — The Strategy Survived Repeated Randomization
To ensure the results were not driven by random luck or isolated market conditions, the best-performing combinations were tested repeatedly using randomized stock universes.
Even after 35 randomized runs, the strongest combinations maintained remarkably stable rankings and attractive median returns.
| Combination | Runs | Median CAGR % | CAGR IQR | Median Drawdown % | Median Trades |
|---|---|---|---|---|---|
| 15% / 5d / 1% | 35 | 17.52% | 14.20–20.27 | -49.34% | 1015 |
| 15% / 3d / 1% | 35 | 15.73% | 12.94–17.81 | -50.32% | 1075 |
| 15% / 7d / 1% | 35 | 15.38% | 10.21–18.63 | -55.71% | 968 |
| 10% / 3d / 1% | 35 | 13.81% | 7.64–17.96 | -74.49% | 2186 |
Equity Curves — Long-Term Compounding Potential
The equity curves below illustrate why the strategy deserves attention. Despite difficult periods and occasional drawdowns, the strongest configurations demonstrated impressive long-term compounding behavior.
Year-by-Year Comparison vs S&P 500
One of the most fascinating aspects of the research appears when we compare yearly performance directly against the S&P 500. The strategy did not simply generate strong long-term returns — it frequently performed best during some of the market’s most difficult periods.
This behavior is extremely important from a portfolio construction perspective. During major bearish environments such as 2000–2002, 2008, and 2022, the strategy significantly outperformed the broader market. That creates the possibility of using the system not only as an alpha-generating side strategy, but also as a potential hedge against broad market weakness.
| Year | S&P 500 % | 15% / 3d / 1% % | Difference vs S&P (pp) |
|---|---|---|---|
| 2000 | -9.10% | 7.23% | +16.33 |
| 2001 | -11.89% | 332.22% | +344.11 |
| 2002 | -22.10% | 3.19% | +25.29 |
| 2003 | 28.68% | 19.75% | -8.93 |
| 2004 | 10.88% | 55.88% | +45.00 |
| 2005 | 4.91% | -2.41% | -7.32 |
| 2006 | 15.79% | 8.83% | -6.96 |
| 2007 | 5.49% | 19.67% | +14.18 |
| 2008 | -37.00% | 22.15% | +59.15 |
| 2009 | 26.46% | -4.76% | -31.22 |
| 2010 | 15.06% | 32.28% | +17.22 |
| 2011 | 2.11% | -14.32% | -16.43 |
| 2012 | 16.00% | -1.18% | -17.18 |
| 2013 | 32.39% | 7.22% | -25.17 |
| 2014 | 13.69% | 43.50% | +29.81 |
| 2015 | 1.38% | 2.13% | +0.75 |
| 2016 | 11.96% | -10.59% | -22.55 |
| 2017 | 21.83% | 21.50% | -0.33 |
| 2018 | -4.38% | 49.32% | +53.70 |
| 2019 | 31.49% | 181.74% | +150.25 |
| 2020 | 18.40% | -6.11% | -24.51 |
| 2021 | 28.71% | -11.56% | -40.27 |
| 2022 | -18.11% | 41.93% | +60.03 |
| 2023 | 26.29% | -4.18% | -30.47 |
| 2024 | 25.02% | 7.33% | -17.69 |
| 2025 | 17.88% | 23.57% | +5.69 |
| Average | 9.69% | 31.70% | +22.01 |
| Median | 13.29% | 7.78% | -5.51 |
| Worst Year | -37.00% | -14.32% | +22.68 |
The median yearly return of the S&P 500 was slightly higher, which is expected because long-only equity markets naturally benefit from persistent long-term upward drift. However, the strategy experienced dramatically smaller worst-case yearly declines. The largest yearly loss for the strategy was only -14.32%, while the S&P 500 lost -37% during the 2008 financial crisis. That asymmetry is extremely valuable. It suggests the strategy may serve as an effective hedge during difficult market environments while still offering attractive long-term upside potential.
Why This Strategy Is Interesting
The most exciting aspect of this research is not the absolute CAGR values. It is the consistency of the underlying behavioral edge.
Markets repeatedly displayed similar mean-reversion behavior across multiple decades, crises, volatility regimes, and randomized stock selections.
While the drawdowns make it unsuitable as a full standalone portfolio, the system may work exceptionally well as a complementary alpha engine alongside trend-following or long-term investing strategies.
- Extreme moves consistently produced better opportunities than smaller moves.
- The profitable region remained stable across repeated tests.
- Long-term equity curves showed strong compounding potential.
- The strategy remained effective even after 2020 market regime changes.
- The logic is simple, transparent, and easy to automate.
The backtest still represents an optimistic simulation. It does not include commissions, slippage, short borrow costs, or survivorship bias corrections.
Final Thoughts
Quantitative trading opportunities are extremely difficult to find — especially strategies that continue to behave consistently over decades of historical data.
This contrarian mean-reversion model appears to capture a real behavioral tendency inside equity markets: short-term overreaction.
No strategy is perfect, and drawdowns are unavoidable. However, as a side strategy designed to complement a broader portfolio, this approach shows genuinely promising characteristics.