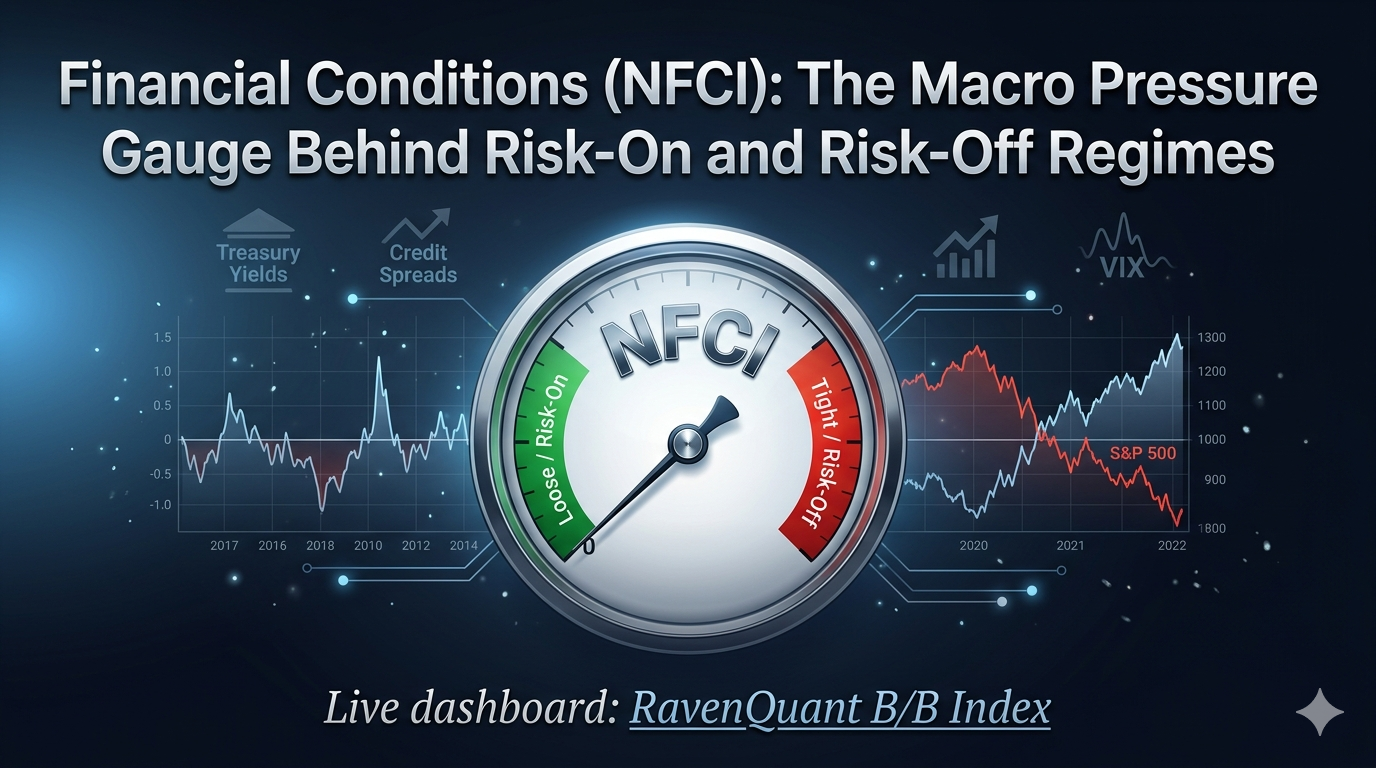
Financial Conditions (NFCI) are a core market regime signal for investors. The Chicago Fed National Financial Conditions Index (NFCI) is designed to summarize how easy or tight the U.S. financial system is at a given time by combining information from money markets, credit markets, leverage metrics, and risk indicators. When conditions are loose, capital tends to flow more easily into households, businesses, and risk assets. When conditions tighten, financing costs rise, risk appetite falls, and market fragility increases.
What NFCI Measures and Why It Matters
NFCI is a standardized composite where higher values indicate tighter-than-average financial conditions and lower values indicate looser-than-average conditions. It captures the combined effect of rates, spreads, funding stress, and broader financial transmission channels rather than any single variable in isolation.
That is exactly why it is useful for regime work. A single indicator like Treasury yield, high-yield spread, or VIX can move for many reasons. NFCI aggregates those pressures into one broad signal that better reflects the state of the financing environment facing the real economy and risk assets.
How to Read Tightening vs. Easing Regimes
As a practical rule, a rising NFCI trend usually means financial conditions are tightening, which is typically a headwind for equities, cyclical exposures, and lower-quality credit. A falling NFCI trend usually means conditions are easing, which tends to support risk-taking, multiple expansion, and broader market participation.
The signal is most informative in direction and persistence, not in one-off weekly moves. A brief noise spike does not define a regime, but a sustained uptrend in NFCI often aligns with periods where macro downside risks and market drawdown probability increase.
Case Study: 2022 Tightening Shock
The 2022 environment is a useful reference point. Policy tightening, wider credit spreads, and repricing across duration-sensitive assets combined into a broad tightening of U.S. financial conditions. Even when earnings did not collapse immediately, valuation pressure and risk premia repriced sharply as financing conditions deteriorated.
This is the key regime takeaway: financial conditions can tighten materially before macro data fully confirms the slowdown. That early tightening is often where risk-on positioning becomes most vulnerable.
How RavenQuant Integrates Financial Conditions in Real Life
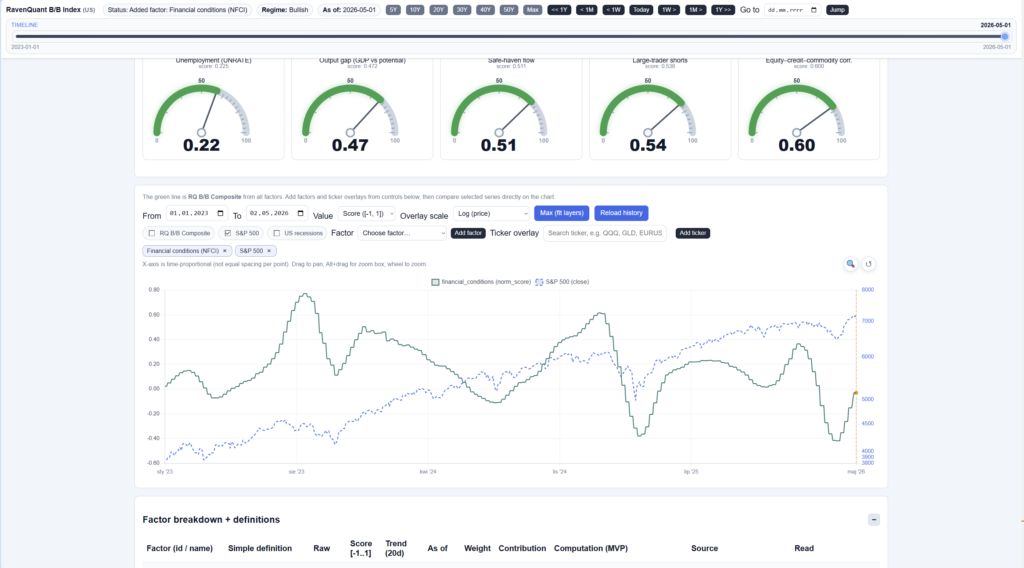
Financial Conditions Factor vs SP500 Chart
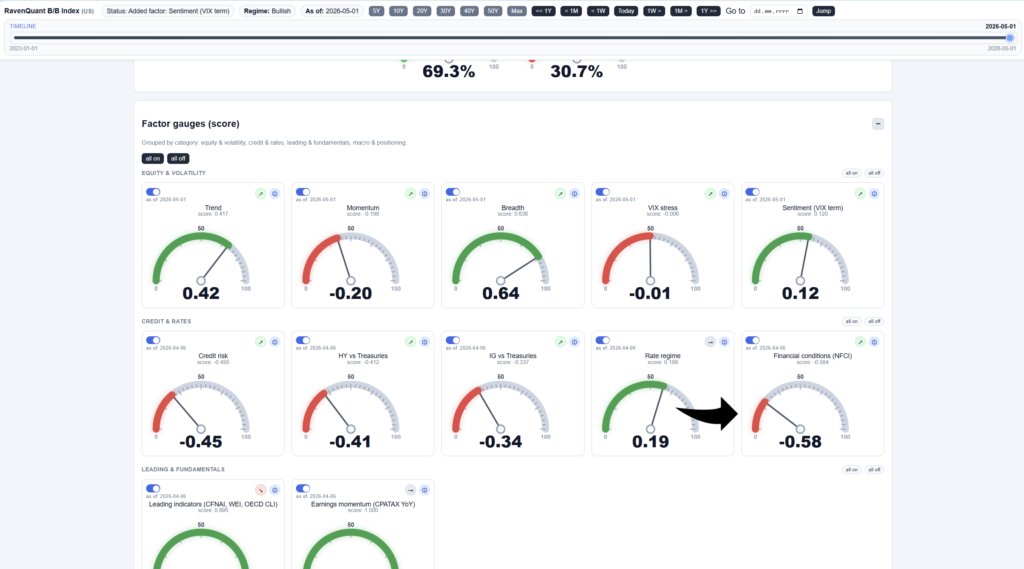
In the live RavenQuant B/B Index, Financial Conditions are represented by NFCI as a dedicated macro factor. Rising and persistent tightening pressure reduces the composite risk-support profile, while sustained easing improves it. This allows the model to reflect system-level financing stress directly instead of relying on only one market proxy.
Limitations and Practical Use
NFCI is not a short-term trading trigger. It is best used as a regime backdrop and risk-budgeting input, especially in combination with trend, credit, volatility, and labor-market factors. Regime alignment across multiple factors is usually more reliable than any single indicator on its own.
Because financial conditions can shift gradually, investors should focus on trend persistence and cross-factor confirmation rather than reacting to isolated weekly changes.
RavenQuant B/B Index
Explore the live index here: https://bull-bear-analyzer-production.up.railway.app
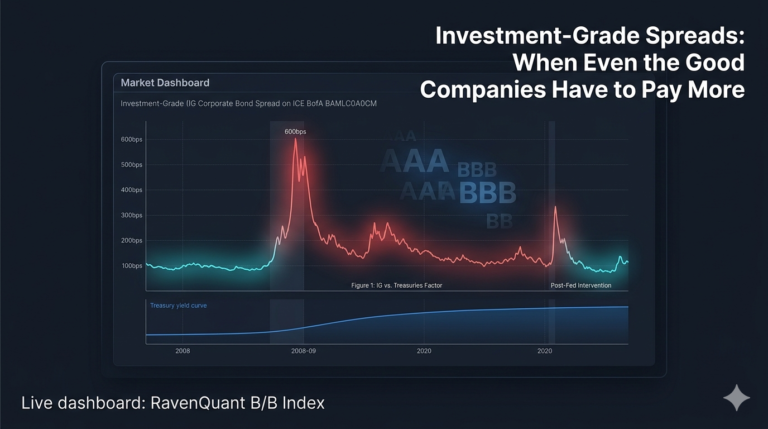
Live dashboard: RavenQuant B/B Index Investment-Grade Spreads is a key market regime signal for investors. There is a version of credit market stress that sometimes flies under the radar because people associate credit blowups with junk bonds. High-yield spreads spike,…
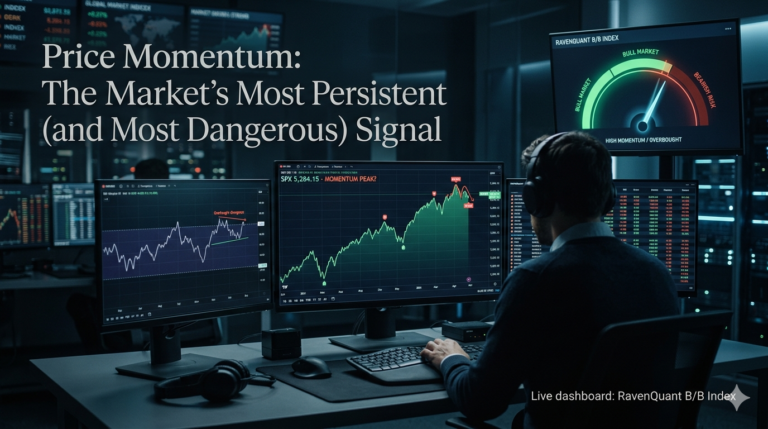
Live dashboard: RavenQuant B/B Index There are not many ideas in finance that have survived decades of academic scrutiny, real-world trading, multiple market cycles, and still show up reliably in the data. Price momentum is one of them — and…
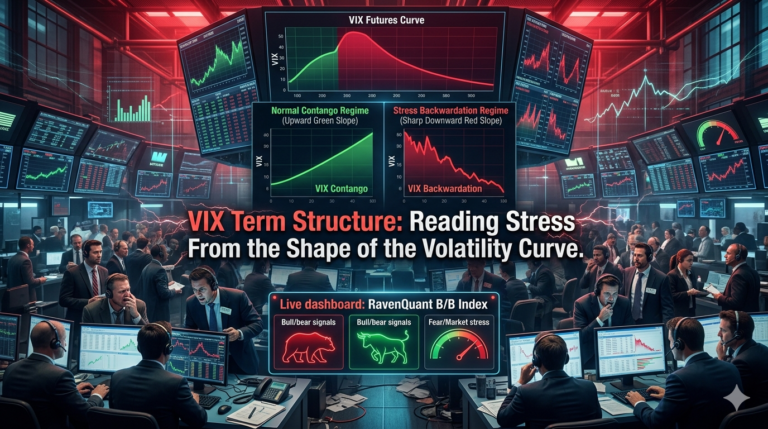
Live dashboard: RavenQuant B/B Index VIX Term Structure is a key market regime signal for investors. Most market participants know what the VIX is – the CBOE Volatility Index, often called the “fear gauge,” measuring the market’s expectation of 30-day…
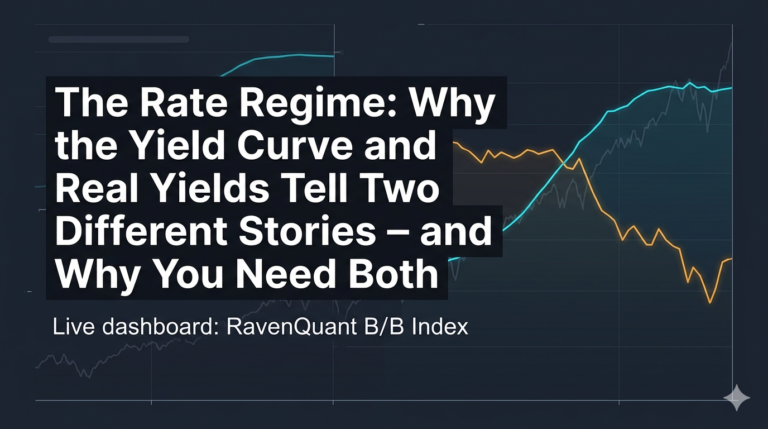
Live dashboard: RavenQuant B/B Index The yield curve gets talked about endlessly in financial media, and for good reason. It has an astonishing track record as a recession indicator. But using it in isolation misses half the story of what…
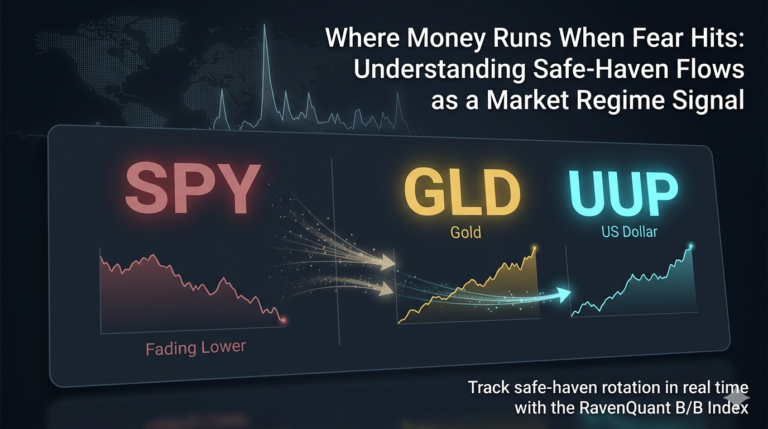
Live dashboard: RavenQuant B/B Index Safe-Haven Flows is a key market regime signal for investors. Ask anyone who has traded through a genuine risk-off event — not a routine 3% pullback, but the kind of episode where screens go red…
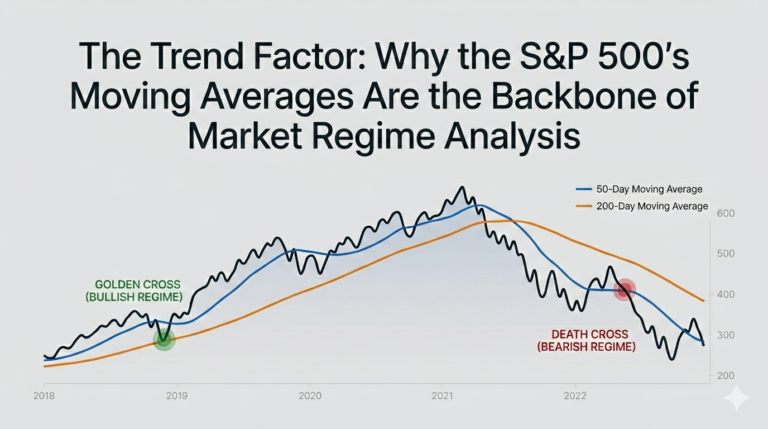
Why Moving Averages Still Matter in 2026 This article is part of the series describing the factors included in the RavenQuant Bear/Bull Index. For as long as markets have existed, traders have tried to answer one fundamental question: is this…
Strategies, Tools, Analyses
RavenQuant News and Perks Directly to Your Inbox
Join 12,000+ traders receiving our newsletter.
RQ Subscription
Enter your professional email to begin receiving backtest reports, news and more.