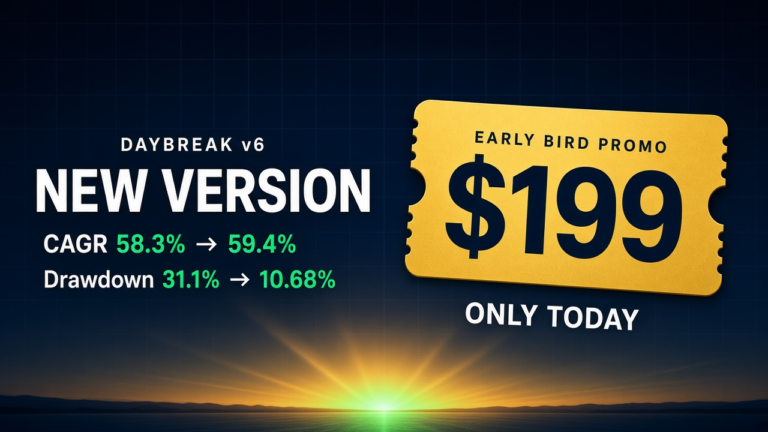
Coming soon — stay tuned
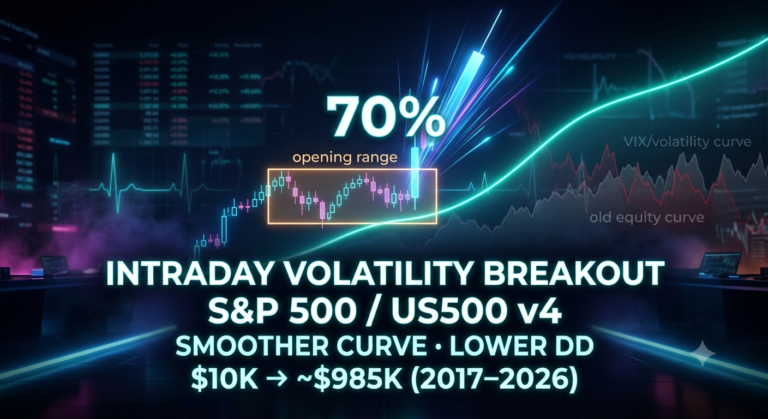
The RavenQuant Daybreak Intraday Volatility Breakout Strategy will be available to purchase shortly. We are putting the finishing touches on this automated intraday volatility breakout strategy release, and full launch details — pricing, supported brokers, and setup guides — will be announced first on our blog and social channels.
Follow the RavenQuant blog and our social media to stay in the loop. That is the best way to catch the launch announcement and get early access when this institutional-grade intraday volatility breakout strategy goes live.
The market open is the most chaotic hour of the financial day. Overnight news, European session carryover, and institutional rebalancing collide in a surge of volume and price discovery. For most retail traders, this first hour is a minefield of false breakouts and emotional traps. For systematic traders, however, this concentrated pocket of volatility is not noise — it is an exploitable momentum window.
Rather than trying to guess the day’s direction or hold through overnight market-moving events, our RavenQuant Daybreak system approaches the US500 (S&P 500) with mechanical discipline. It implements an institutional-grade, fully automated Intraday Volatility Breakout Strategy: it reads the early-session range, trades the breakout in whichever direction the market commits, and closes all exposure before the day ends. This article explains the structural advantages behind this specific intraday volatility breakout strategy and the exceptional performance results we measured — while the precise parameters and proprietary filters remain part of our product.
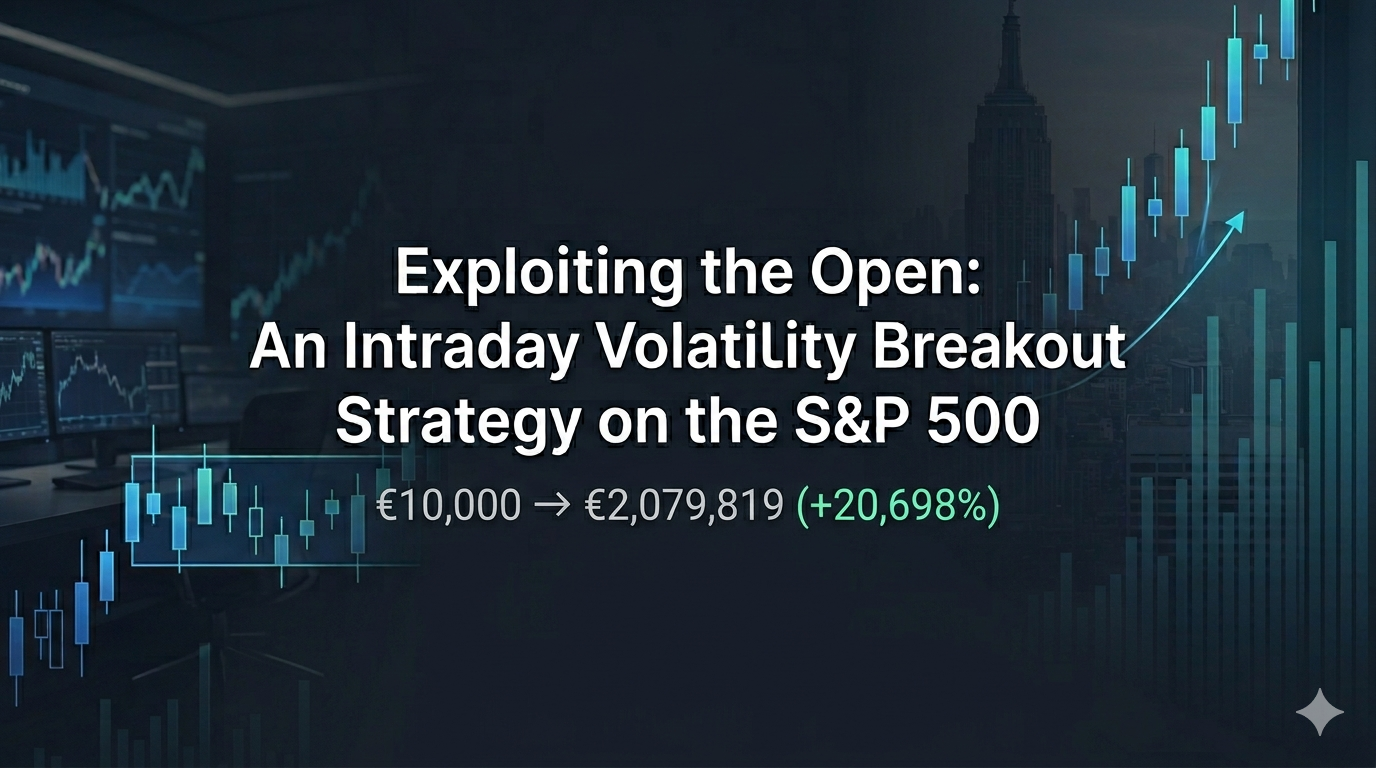
The results of this approach were striking. In backtests spanning nearly a decade (June 2017 – June 2026), the aggressive High-Risk profile delivered a hypothetical +20,698% total return, turning €10,000 into roughly €2.08 million. The balanced Medium-Risk profile returned +8,694% with an exceptionally smooth equity path. Over the same period, a passive buy-and-hold position in the S&P 500 returned roughly +212% — a strong decade for stocks, yet a different universe of outcomes.
Total Return*
+20,698%
High-Risk profile, 2017–2026
CAGR*
~80%
Compound annual growth
Sharpe Ratio*
3.07
Risk-adjusted quality
Overnight Risk
Zero
Flat in cash every night
The Historical Roots of the Opening Range Breakout
Trading the open is a well-established idea in quantitative finance. It was popularised in the late 1980s and early 1990s by trader Toby Crabel in his classic work “Day Trading with Short Term Price Patterns and Opening Range Breakout.” Crabel’s thesis was simple: when price moves a meaningful distance away from an early equilibrium, the odds of continuation in that direction rise materially.
The edge exists because of the intraday structure of modern equity markets. Volume and volatility in the S&P 500 follow a persistent “U-shaped” curve: activity spikes after the opening bell, fades through the midday lull, and rises again into the close. The first part of the session is where overnight information gets digested, where the largest institutional orders are worked, and where the day’s directional commitment usually forms.
How the Strategy Works (the General Idea)
The underlying logic behind our intraday volatility breakout strategy is intentionally simple; the real value lies in disciplined, automated execution. Built in MQL5 for MetaTrader 5, the RavenQuant Daybreak system utilizes modular logic to execute this precise intraday volatility breakout strategy with cold consistency. At a high level, the system follows four clean phases:
1. Read the opening range
During a defined early-session window, the EA measures the high and low that price establishes — the day’s initial battle line between buyers and sellers.
2. Arm both directions
Resting breakout orders are placed on both sides of that range on a one-cancels-other basis. The strategy stays direction-neutral and simply follows whichever side the market breaks.
3. Size by risk, not by guess
Each position is sized from a chosen percentage of account equity, with the protective stop tied to the range itself. Dollar risk per trade stays consistent regardless of how wide or narrow the day’s range is.
4. Manage, then go flat
Winning trades are protected and allowed to run with adaptive stop management. Whatever happens, all exposure is closed before the session ends — the account returns to cash overnight.
On top of this core, the system layers a proprietary volatility filter (to sit out low-quality days), broker-independent risk profiles, and an order-splitting engine that lets large positions keep compounding past a broker’s per-order size cap. The exact windows, thresholds, and coefficients are deliberately not published here.
| Element | Approach |
|---|---|
| Underlying asset | US500 (S&P 500 index CFD) |
| Style | Intraday Volatility Breakout Strategy, executing both long and short breakouts |
| Risk model | Risk-based position sizing with selectable profiles |
| Protective stop | Anchored to the measured opening range |
| Trade management | Adaptive stop protection with a strict same-day exit |
| Overnight exposure | None — flat in cash outside the session |
| Execution | Fully automated MQL5 Expert Advisor for MT5 |
Performance: Quantitative Edge vs. Buy-and-Hold
To evaluate the model, we compared RavenQuant Daybreak’s backtest reports against a passive buy-and-hold position in the S&P 500. The test covers June 2017 – June 2026, a window that includes the 2018 correction, the 2020 COVID crash and recovery, the 2022 bear market, and the strong bull runs of 2024–2025.
The clearest way to feel the difference is to watch both accounts grow side by side. The chart below tracks an actual backtest equity curve of a moderate Daybreak configuration against a buy-and-hold position in the index, both starting from €10,000 and plotted on a logarithmic scale (each gridline is a 10× step).
Two things stand out. First, the gap is structural, not a single lucky year — the blue curve pulls ahead steadily across the whole period. Second, the strategy’s steepest advances often come precisely when the market is most turbulent (2020, 2022), because volatility is the very fuel a breakout system feeds on.
| Metric (Jun 2017 – Jun 2026) | Daybreak (High-Risk) | Daybreak (Medium-Risk) | Buy-and-Hold (S&P 500) |
|---|---|---|---|
| Total net return (€10k start) | +20,698% | +8,694% | ~+212% |
| CAGR | ~80% / yr | ~60% / yr | ~13.5% / yr |
| Sharpe ratio | 3.07 | 4.95 | ~0.8 |
| Overnight gap risk | Zero | Zero | Full exposure |
| Bear market (e.g. 2022) | Profited from downside | Profited from downside | Deep drawdown |
| Final value (€10,000 start) | €2,079,819 | €879,400 | ~€31,200 |
While the passive S&P 500 position delivered a respectable +212% (growing €10,000 to roughly €31,200), the Medium-Risk profile reached €879,400 with an exceptionally high Sharpe ratio of 4.95 — a smooth, controlled compounding path. The aggressive High-Risk profile multiplied the account over 200-fold to more than €2 million while still maintaining a robust Sharpe ratio of 3.07.
Under the Hood: The Anatomy of a Robust Breakout
Rather than relying on luck or a single rigid parameter set, the success of a robust intraday volatility breakout strategy is rooted in fundamental market mechanics. When we analyze thousands of different simulation runs across a decade of market history, several structural principles emerge that explain why the RavenQuant Daybreak intraday volatility breakout strategy maintains such a durable, repeating edge:
- The power of “Volatility Clustering”. High volatility is highly contagious. If the S&P 500 experiences a sharp, high-volume move in the first hour of trading, that energy typically feeds on itself, driving a sustained directional expansion through the rest of the day. By waiting for the opening range to fully establish, the strategy rides this wave of high-probability momentum.
- Mandatory stop loss asymmetry. Intraday breakouts are trend-following by design. The math is simple: when a breakout is real, it runs far in our direction. When a breakout is false, it reverses quickly. By anchoring our protective stop directly to the opposite side of the morning range, we cut failing breakouts immediately while allowing winning trades to expand freely under an adaptive trailing stop.
- Eliminating midday noise. The S&P 500 frequently chops sideways during the middle of the European/US lunch overlap. Entering trades too late in the afternoon or holding them in the final sleepy hour of the session degrades risk-adjusted returns. The strategy’s timing module is built around this reality: it captures the morning expansion and ensures all positions are closed or tightly protected before the late-day drift begins.
- Sizing by actual market risk. On highly volatile days, the morning range is naturally wider, which means the stop loss distance is larger. On quiet days, the range is narrower. A dynamic risk-manager ensures that the actual lot size is scaled proportionally. You risk the exact same percentage of your capital on every setup, whether the market is crawling or crashing.
This mechanical consistency is what separates systematic quantitative trading from retail guesswork. By automating every rule — from range detection to risk scaling and trailing exits — the model removes fear, hesitation, and greed from the equation, turning the daily chaos of the opening bell into a structured, repeatable business process.
Why Daybreak Outperforms Passive Investing
The performance gap is not a quirk of curve-fitting. It reflects structural advantages inherent to executing an automated intraday volatility breakout strategy:
1. No overnight gap risk
Passive investors are exposed 24/7. An overnight shock — a geopolitical event, a bad earnings release, a credit scare — gaps the market at the next open with no chance to react. Daybreak is flat in cash every night and weekend, sidestepping this entire class of risk.
2. Dynamic compounding
Passive returns grow only with the index. Daybreak risks a set percentage of equity per trade, so size scales with the account. An order-splitting engine ensures compounding isn’t capped by a broker’s maximum order size.
3. Selective participation
A passive holder must endure every regime, including dead and toxic conditions. A volatility filter lets Daybreak sit out low-quality days, preserving capital for the setups where the edge is strongest.
A Systematic View of the Advantages
- Defined, asymmetric risk: Passive index risk is the full value of the index, which can fall 30–50% in a deep bear market. Daybreak’s risk is capped on every trade by a range-based stop, while winners are carried by adaptive stop management.
- Uncorrelated returns: Because it trades both long and short breakouts, the strategy’s returns don’t depend on the market’s direction. In the 2022 bear market it profited from downside momentum while passive investors lost ground.
- Capital efficiency: A passive position locks up capital indefinitely. Daybreak only needs margin for a few hours a day, freeing capital and margin the rest of the time.
- No emotional interference: Greed, FOMO, panic, and revenge trading destroy retail accounts. A fully automated system executes the same rules with cold consistency — it doesn’t sleep, fear, or deviate.
Conclusion: Mastering the Open
Passive index investing remains a sound long-term savings approach, but quantitative analysis shows it leaves real risk-adjusted return on the table — forcing investors to endure overnight gaps, multi-year drawdowns, and inefficient capital lockups.
By narrowing focus to the market’s most statistically significant intraday window and executing our disciplined intraday volatility breakout strategy, the RavenQuant Daybreak system aims for a different class of outcome. Turning €10,000 into €879,400 (Medium-Risk) or more than €2 million (High-Risk) across the 2017–2026 backtest illustrates the power of a systematic, automated intraday volatility breakout strategy. In modern markets, the edge belongs not to those who guess the future, but to those who master the mechanics of the open.