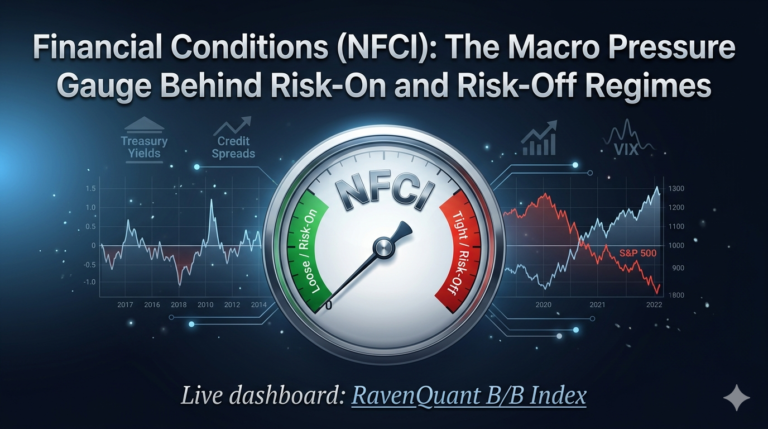
Live dashboard: RavenQuant B/B Index
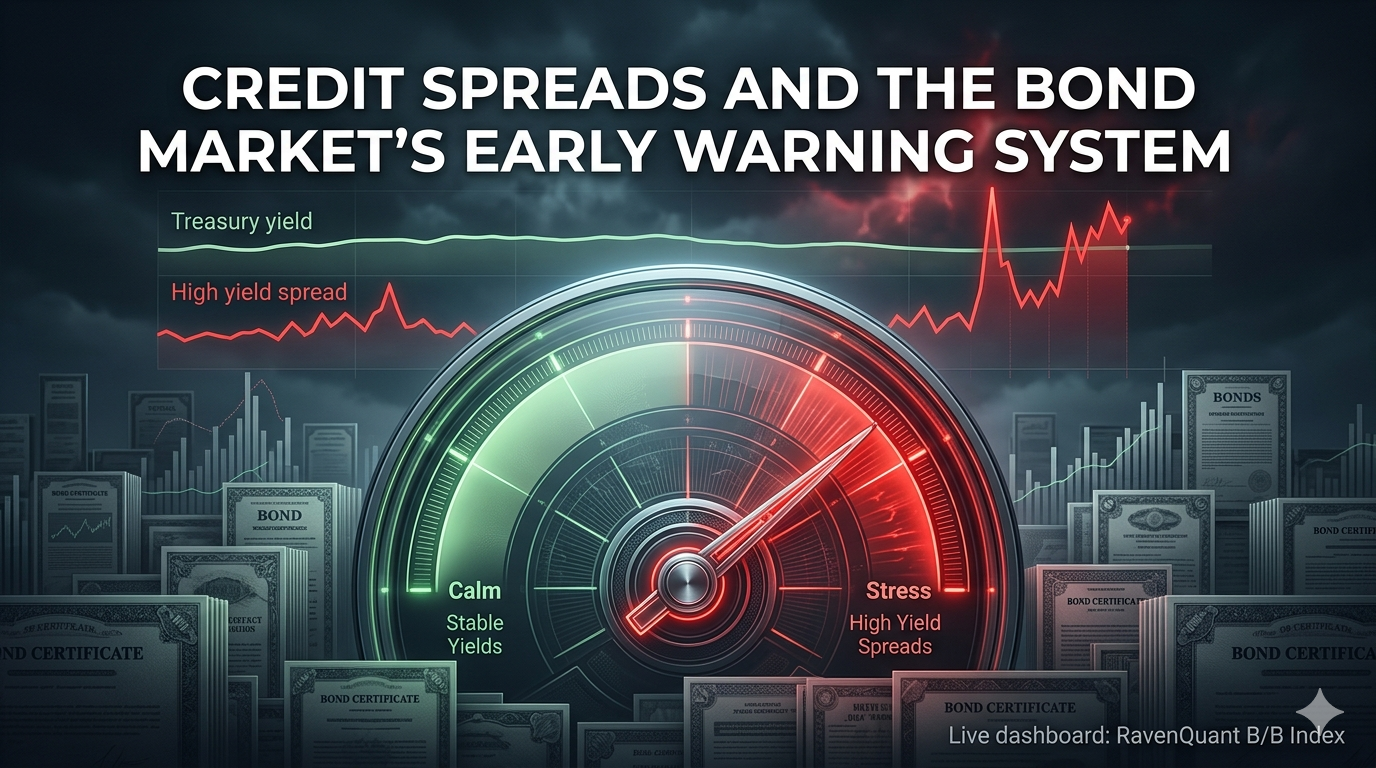
Equity traders have a tendency to treat the stock market as the authoritative source of truth on the economy. It’s visible, liquid, and updated every second. But bond markets — and credit markets in particular — often price in stress before equities do. When corporate credit spreads start moving, serious market participants pay attention, because the bond market has historically been the canary in the coal mine.
What Credit Spreads Actually Measure
Before getting to the regime implications, it helps to understand what OAS actually measures. An option-adjusted spread is the yield premium a bond offers over a risk-free benchmark (typically US Treasuries), after adjusting for any embedded options in the bond structure. For plain-vanilla corporate bonds, it’s essentially the extra yield investors demand as compensation for taking on credit risk — the risk that the issuer might not pay them back in full.
Investment-grade bonds are issued by companies with strong balance sheets and relatively low default probabilities — think large, established corporations rated BBB or higher by the major rating agencies. High-yield bonds (commonly called junk bonds) are issued by companies with weaker credit profiles, rated below BBB. They must offer higher yields to attract buyers who are accepting meaningfully more default risk.
The HY-IG spread difference — the gap between high-yield OAS and investment-grade OAS — tells you how much extra risk premium the market is demanding beyond baseline credit risk. In calm environments, investors are comfortable reaching for yield and the spread difference is relatively compressed. When stress builds, investors get selective — they don’t want junk — and that risk aversion shows up as spread widening.
Why Widening Spreads Matter for Regime Risk
The logic runs in both directions simultaneously. When HY spreads blow out, it’s harder and more expensive for lower-quality companies to borrow. Higher financing costs squeeze earnings, potentially leading to credit events — covenant violations, defaults, distressed exchanges. Equity markets tend to anticipate this transmission mechanism, usually with a lag of weeks to months.
More importantly, spread widening is often a real-time indicator of what’s happening inside the financial system that equity prices haven’t fully repriced yet. Institutional credit investors — banks, insurance companies, specialized credit funds — are doing fundamental credit analysis on individual issuers. When they collectively start demanding dramatically more yield, they’re pricing in a deterioration they can see in earnings, cash flows, and balance sheet health that the average equity investor might not be tracking as closely.
The ICE BofA OAS spreads are the standard benchmark dataset for this analysis. FRED (the Federal Reserve Bank of St. Louis’s data repository) publishes both series — the high-yield index under ticker BAMLH0A0HYM2 and the investment-grade index under BAMLC0A0CM — with daily updates and long historical records. They’re freely accessible and widely used in institutional macro analysis.
Historical Stress Episodes and Live Tracking
The 2008–2009 financial crisis produced the most extreme credit stress in modern history. The ICE BofA US High Yield Index OAS reached a record high of 21.82% (2,182 basis points) in December 2008, according to Federal Reserve data — a level that reflected genuine fears about cascading corporate defaults in a frozen credit market. At those spreads, many high-yield issuers simply couldn’t access capital markets at any reasonable cost. Investment-grade spreads also blew out dramatically, though to a far smaller absolute level. The gap between the two — the HY-IG differential — told you clearly that markets had bifurcated into companies that could survive and companies that might not.
In March 2020, the dynamic was faster and in some ways more brutal. The ICE BofA US High Yield OAS widened from 360 basis points at the end of 2019 to 1,087 basis points on March 23, 2020 — a tripling of the spread in roughly three months as lockdowns forced revenue to zero for entire sectors of the economy. That spread peak on March 23 happened to coincide almost exactly with the equity market bottom. Credit, in that case, was marking the panic simultaneously with equities rather than leading it — but the sheer magnitude of the spike was itself a signal that the stress was being taken seriously.
The leading-indicator quality of credit isn’t always dramatic. It often shows up as slow, persistent drift rather than a sudden blowout. In the months leading into the 2008 crisis, high-yield spreads were already widening through the second half of 2007 — well before the S&P 500 peaked in October 2007 and long before the acute phase of the crisis. Investors who were watching credit while equity markets were still making new highs had a genuine early warning.
The reason for this dynamic is partly structural. Credit investors hold debt with specific cash flow obligations — they can’t benefit from upside beyond their coupon and principal, so they’re inherently more focused on downside scenarios. Their pricing tends to be more sensitive to deteriorating fundamentals early, because there’s no equity upside to offset credit concerns. When investment managers running high-yield portfolios start backing away from new issuance and demanding wider concessions in secondary markets, it reflects a real-time fundamental reassessment that often precedes what equity prices show.
Two ETFs serve as widely-tracked proxies for the underlying credit market dynamics: HYG (the iShares iBoxx High Yield Corporate Bond ETF) and LQD (the iShares iBoxx Investment Grade Corporate Bond ETF). Watching the performance spread between these two — or more directly, the ratio — gives you a live market-based read on credit risk appetite. When HYG is underperforming LQD significantly, the credit market is risk-off.
For more precise regime analysis, the underlying OAS data from FRED is worth using directly rather than ETF prices, which removes duration and interest-rate effects from the signal. The pure spread captures credit risk, not rate sensitivity — a cleaner read on this particular factor. The raw FRED data for both series is publicly available and worth bookmarking if you want to track this independently.
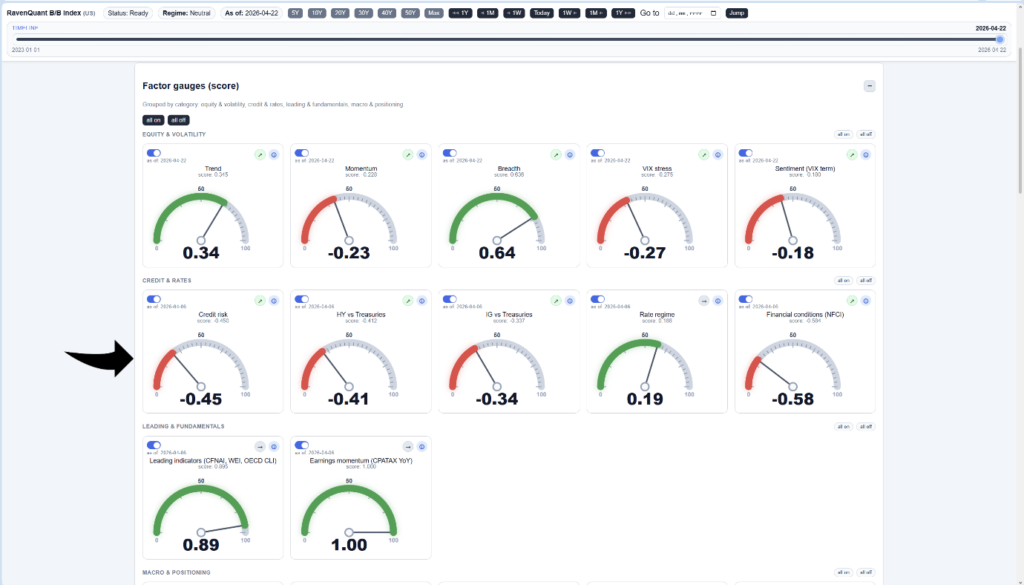
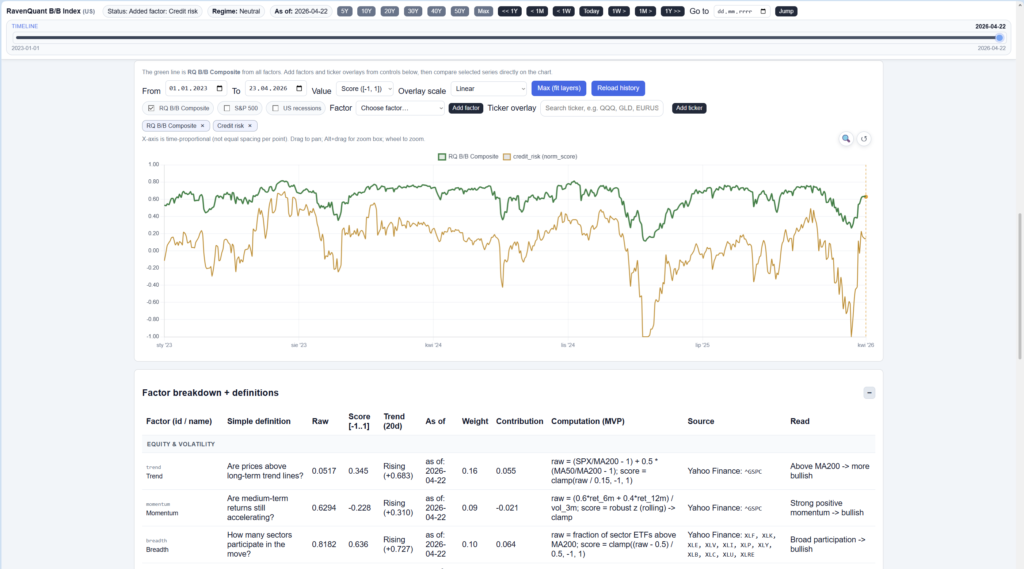
If you want to see how the HY-IG credit spread is currently reading and whether it’s been tightening or widening in recent weeks, it’s one of the inputs tracked in the RavenQuant B/B Index — credit stress that’s building is categorically more concerning than stress that’s peaked and reversing, and the 20-day trend direction captures exactly that distinction.
Explore the live index here: https://bull-bear-analyzer-production.up.railway.app