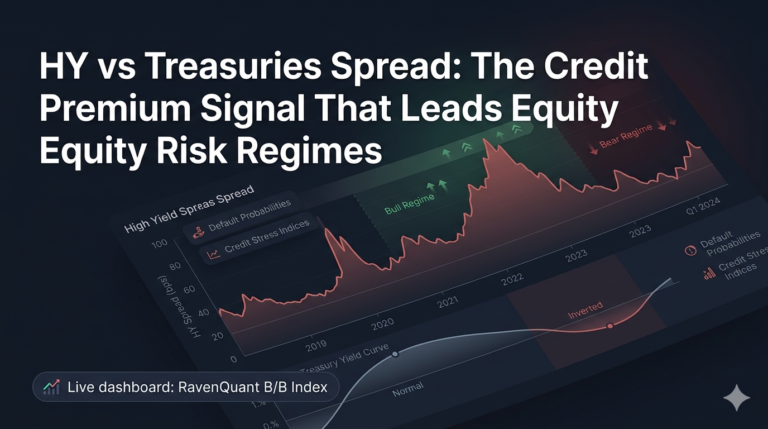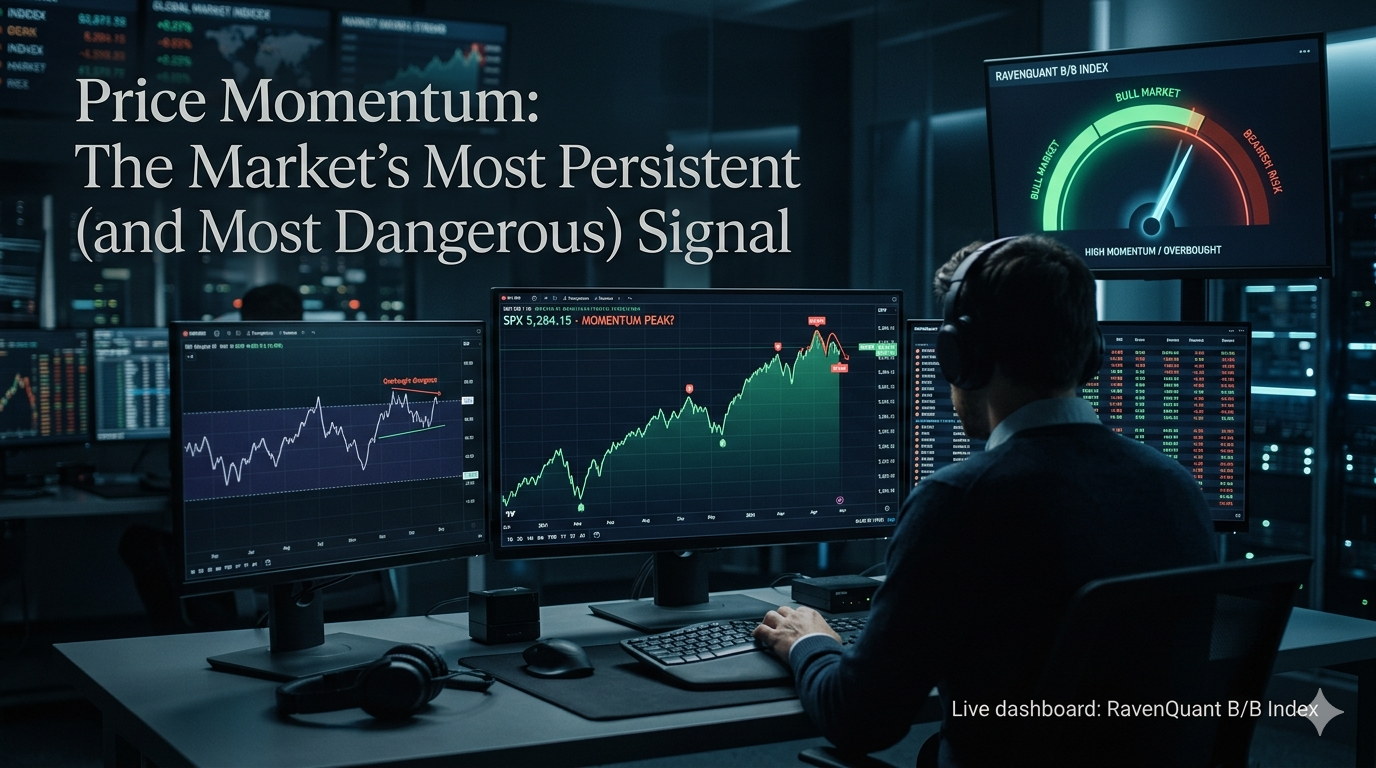
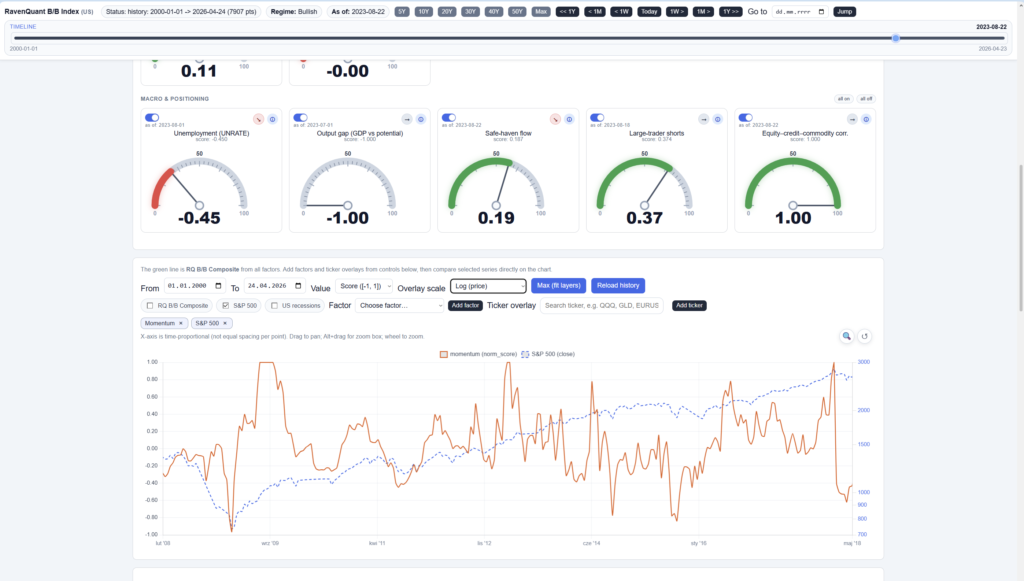
Live dashboard: RavenQuant B/B Index
There are not many ideas in finance that have survived decades of academic scrutiny, real-world trading, multiple market cycles, and still show up reliably in the data. Price momentum is one of them — and that combination of empirical durability and theoretical awkwardness is exactly what makes it worth understanding deeply.
The core observation is deceptively simple: stocks (and other assets) that have performed well over the recent past tend to keep performing well, and recent losers tend to keep underperforming, at least over the medium term. This was formalized in Narasimhan Jegadeesh and Sheridan Titman’s landmark 1993 paper Returns to Buying Winners and Selling Losers, published in the Journal of Finance. They documented that a strategy of buying the past twelve months’ winners and shorting the losers produced statistically significant excess returns — roughly 1% per month — even after controlling for known risk factors. The finance world was not entirely pleased with this finding. Momentum directly challenged weak-form market efficiency, and it took years for the profession to accept it wasn’t going away.
Why Momentum Persists: Behavioral and Structural Drivers
The behavioral explanation is more intuitive than the risk-based one. Investors underreact to information initially — good earnings, an improving competitive position, a sector rotation that’s just beginning — and prices drift toward their fair value over six to twelve months rather than adjusting instantaneously. By the time the full picture becomes obvious, the momentum trade has already played out. Alpha Architect’s synthesis of the momentum literature makes the point that the Jegadeesh and Titman findings have been replicated not just in US equities but in international markets and across asset classes, suggesting this isn’t a data-mining artifact — it’s a genuine feature of how markets process information.
The risk-based story is murkier. There’s no clean explanation for why past winners should carry higher systematic risk than past losers in a way that would justify the return premium. AQR Capital and other systematic managers have written extensively on this, generally concluding that the momentum premium is real but behaviorally driven — which means it persists precisely because it’s uncomfortable to harvest.
How to Read Strong, Weak, and Reversing Momentum Regimes
A simple trailing return is the most obvious way to measure momentum, but it has real problems as a regime signal. A 15% gain over six months in a calm, low-volatility environment is a fundamentally different thing than a 15% gain during a chaotic, high-volatility stretch where the market whipsawed 3% a day to get there. The first is a deliberate, sustained move. The second is noise that happened to net positive.
Risk-adjusting the momentum reading — dividing the composite return by realized volatility — addresses this directly. It asks: was this performance earned in an orderly way, or did it arrive with a lot of collateral damage? Sustained positive risk-adjusted momentum, week after week, is one of the cleanest confirmations of a bull regime. Combining a 6-month and 12-month return window (rather than using either alone) also helps — the 6-month window is more responsive to recent turns while the 12-month adds context about whether the trend has been in place long enough to carry real weight.
Price data for these calculations typically draws on S&P 500 data via Yahoo Finance (^GSPC), which provides daily close prices going back decades without futures rolling complexity or subscription fees.
How Price Momentum Is Applied in the RavenQuant B/B Index
Here’s the honest limitation that anyone using this factor should internalize: momentum is backward-looking by construction. It tells you that something has been going up for six to twelve months and doing so with controlled volatility. It does not tell you what happens next. As a regime confirmation signal — one piece of evidence asking “are conditions currently bullish or bearish?” — it’s excellent. As a standalone forecasting tool, it is nearly useless at turning points.
The most brutal manifestation of this limitation is the momentum crash. After a prolonged bear market, when the losers have been pummeled and the short momentum trade looks most obvious, reversals can be ferocious. March 2009 is the textbook example: the momentum trade was deeply short into the bottom and got absolutely destroyed when the rebound hit. April 2020 was similar — momentum signals had turned deeply bearish as the COVID crash accelerated, and anyone mechanically short the market on the momentum signal got squeezed when the Fed announced emergency interventions and the S&P 500 began one of its fastest recoveries in history.
These crashes don’t mean momentum is broken — they’re actually somewhat predictable in their timing, occurring specifically after long bear markets when valuation spreads between winners and losers are extreme. But they are a reminder that no single factor captures the full picture, and momentum in isolation is particularly dangerous to act on at cycle extremes.
Used alone, momentum is a blunt instrument. Used as one input in a multi-factor view of market structure, it earns its place. When momentum is strongly positive but credit spreads are blowing out or the yield curve is collapsing, the composite should appropriately mute the bullish signal. When momentum aligns with breadth, credit, and macro indicators all pointing the same direction, conviction increases meaningfully. The factor works best as confirmation of what the rest of the market structure is already saying — or as a flag for disagreement that demands attention.
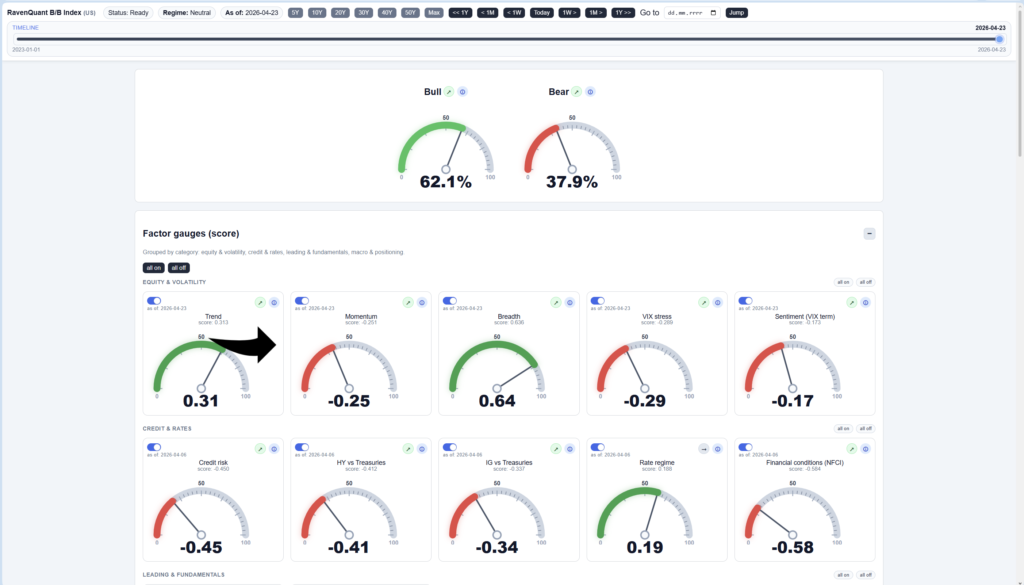
If you want to see how the risk-adjusted momentum reading is currently sitting and whether it’s been trending higher or lower, it’s one of the inputs tracked in the RavenQuant B/B Index. The dashboard shows the normalized score against its own historical distribution alongside the 20-day trend direction — useful context for knowing whether current momentum is genuinely elevated or just mildly positive.
Explore the live index here: https://bull-bear-analyzer-production.up.railway.app