Live dashboard: RavenQuant B/B Index
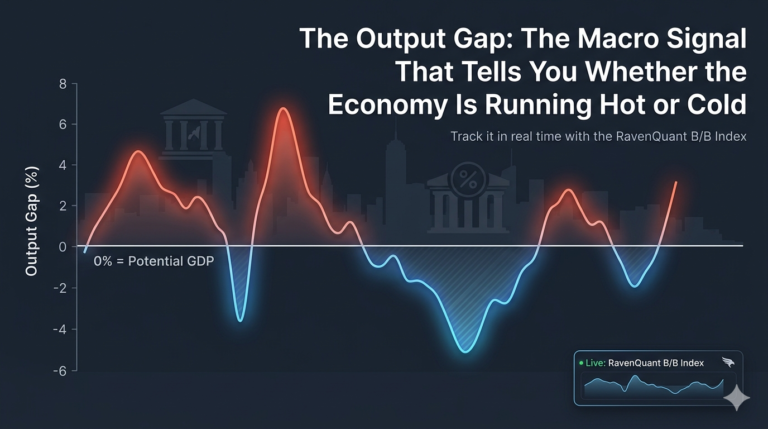
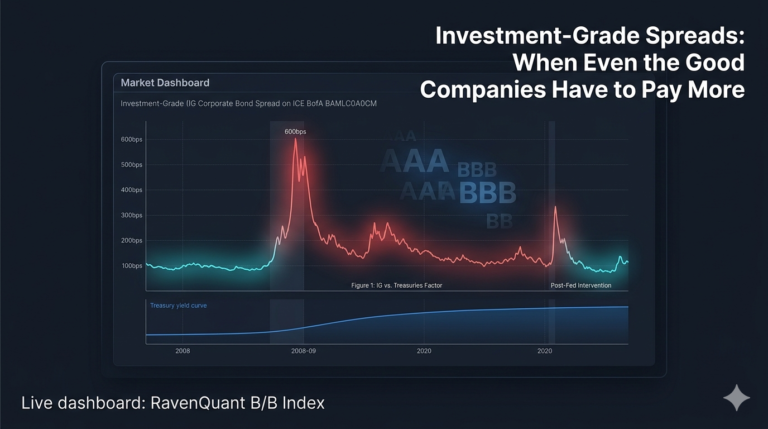
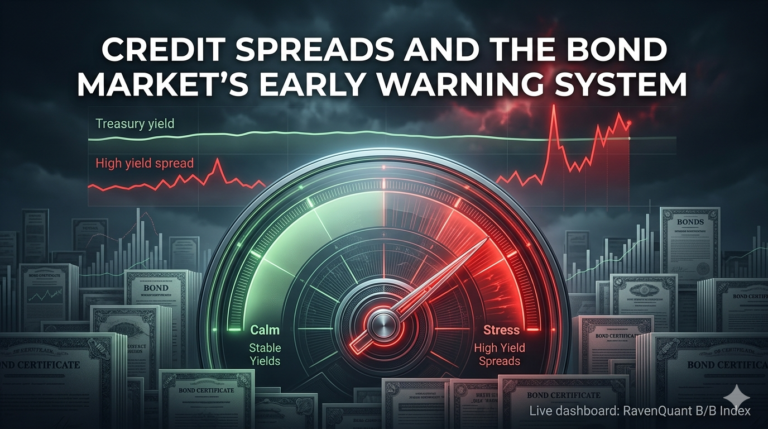
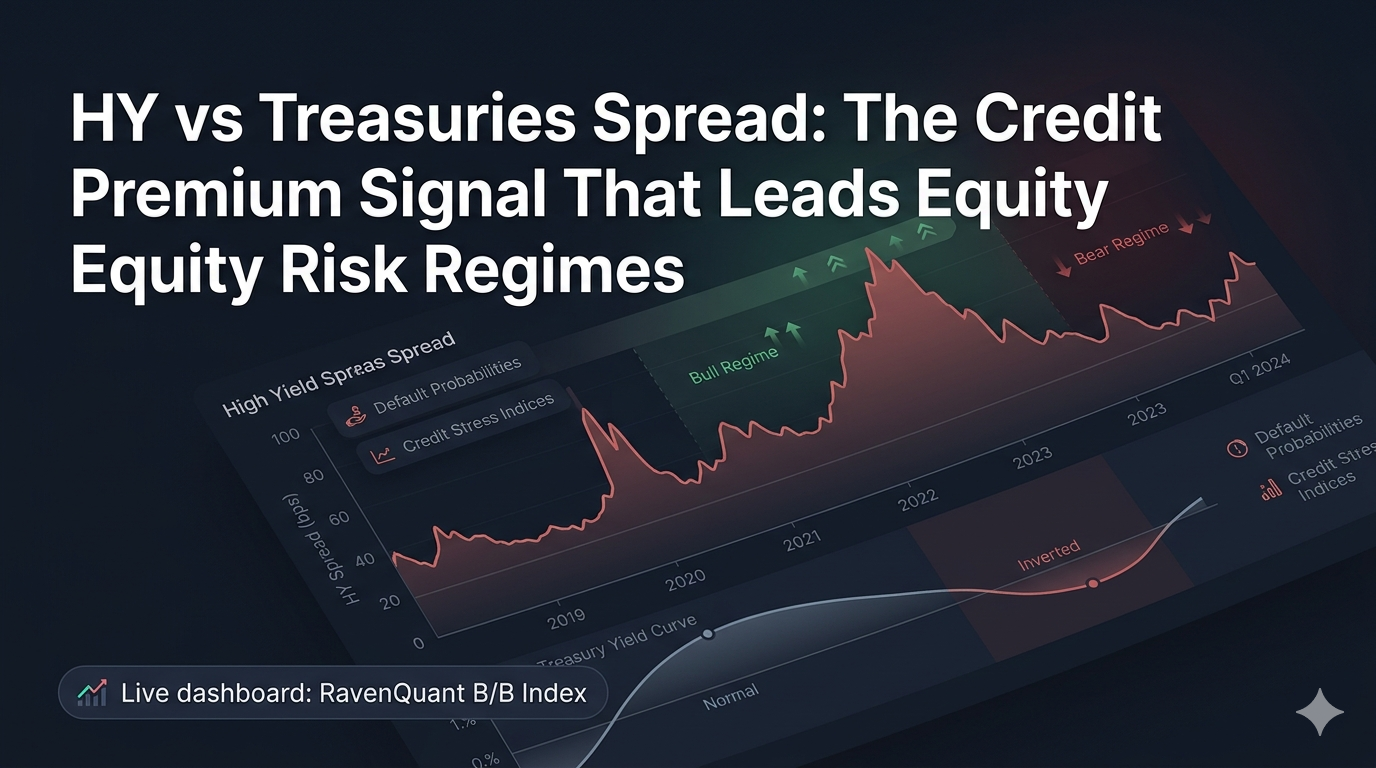
HY vs Treasuries spread is a key market regime signal for investors. While the 10-year Treasury yield defines the base risk-free rate, the spread between high-yield corporate debt and Treasuries captures the extra credit risk premium investors demand. When that spread widens, markets are pricing higher default risk and tighter conditions; when it narrows, risk appetite is usually improving.
Why HY vs Treasuries Spread Adds More Risk Context Than Yields Alone
Every financial asset is theoretically worth the present value of its future cash flows. That sounds dry, but the implication is enormous: the rate you use to discount those future cash flows – the risk-free rate – determines how much you’d pay today. Use a low rate, and future earnings look very valuable. Use a high rate, and suddenly those same earnings look much less appealing.
The 10-year Treasury yield is the market’s best approximation of that risk-free rate. When it moves, it shifts the denominator of every DCF model on Wall Street simultaneously. That is why you sometimes see the entire stock market sell off on a single morning when Treasury yields spike – not because any company reported bad earnings, but because the mathematical framework used to price all those earnings just got more expensive.
This effect is not uniform across the market. Growth stocks – companies whose earnings are mostly in the future, like technology firms with elevated valuations – are far more sensitive to yield changes than, say, a utility with steady, predictable cash flows today. Think of it like duration in bond math: a long-duration bond loses far more price when rates rise than a short-duration one. A high-multiple growth stock is essentially a long-duration financial instrument. When the 10-year yield rises meaningfully, those stocks get repriced the hardest and fastest.
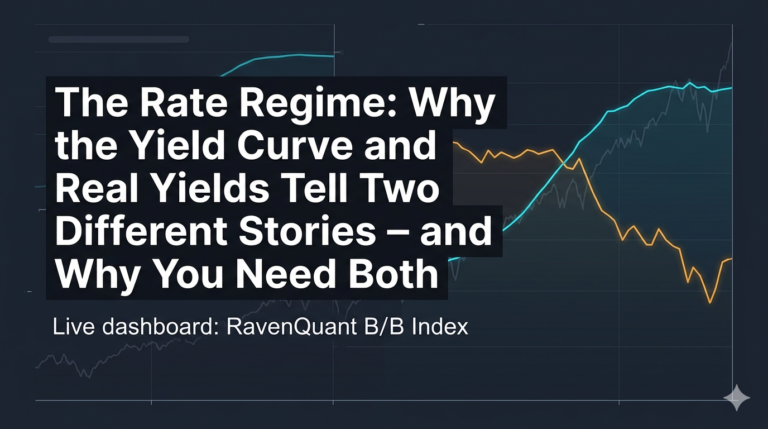
How to Read Rising vs. Falling Yield Regimes for Equities
If you want to understand how devastating a rapid rise in yields can be, 2022 is the clearest case study in recent memory. At the start of that year, the 10-year Treasury yield (FRED series DGS10) sat around 1.5%. By October 2022, it had climbed past 4.2%. That is a move of roughly 270 basis points in less than twelve months – one of the fastest sustained rate rises in modern U.S. history.
The result? The S&P 500 fell roughly 25% from peak to trough in 2022, its worst year since 2008. But the Nasdaq – dominated by long-duration growth names – fell far more, dropping over 30% for the year. This was not a coincidence. The rate shock was the primary driver. Corporate earnings held up reasonably well in 2022; it was the multiple compression – the P/E ratio contracting as the discount rate rose – that did most of the damage.
How HY vs Treasuries Spread Enters the RavenQuant B/B Index
There is a subtlety here that a lot of market commentary misses. It is not just about whether yields are rising or falling – the absolute level matters enormously.
When the 10-year yield is at 2%, it competes very weakly against equity returns. Stock investors are more than happy to accept the risk premium of equities over a 2% “safe” alternative. But when the yield climbs toward 5%, something structurally changes. Suddenly, pension funds and insurance companies – institutions that must meet liability targets – can lock in near-5% returns in U.S. government paper without taking any credit risk. The relative attractiveness of equities declines.
This is the logic behind the Fed model, a framework popularized in the late 1990s that compares the S&P 500 earnings yield (earnings divided by price, the inverse of the P/E ratio) to the 10-year Treasury yield. When the two converge – when the yield you get from owning a Treasury bond approaches the earnings yield on the stock market – equities look expensive on a relative basis. It does not tell you when a correction will happen, but it does tell you that the margin of safety is thin.
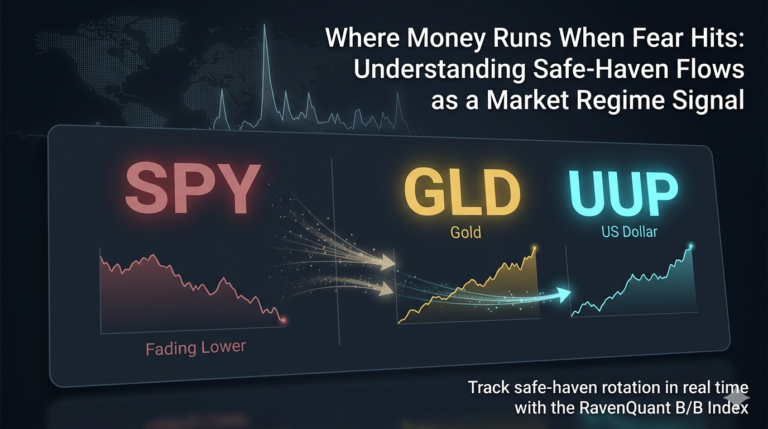
It is tempting to think that falling yields are always bullish for stocks. Usually they are, because a lower discount rate makes future earnings more valuable. But there is an important exception that trips up a lot of people: yields that fall because the economy is deteriorating.
When investors flood into Treasuries as a safe haven – driving prices up and yields down – that signal can mean recession fears are escalating. A falling 10-year yield alongside a widening credit spread and rising unemployment is a completely different regime than a falling yield after a Fed rate cut in a healthy economy. The direction of the yield and the reason for that direction are not the same thing, and conflating them leads to bad conclusions. No single yield reading exists in a vacuum – context from credit markets, economic momentum, and positioning data all shape what a given yield level actually means for equities.
The 10-year yield is an exceptional macro signal, but it has real blind spots. It tells you about the current repricing pressure on equity valuations, but it says nothing about whether corporate earnings can hold up in a higher-rate environment. Yields can remain elevated for years without a corresponding equity bear market if earnings growth is strong enough to offset multiple compression. Conversely, yields can fall rapidly into a worsening recession, producing a situation where the “bullish” falling-yield signal is actually reflecting deteriorating fundamentals. Reading the yield in isolation, without reference to credit spreads, growth data, and policy signals, is a reliable way to draw wrong conclusions.
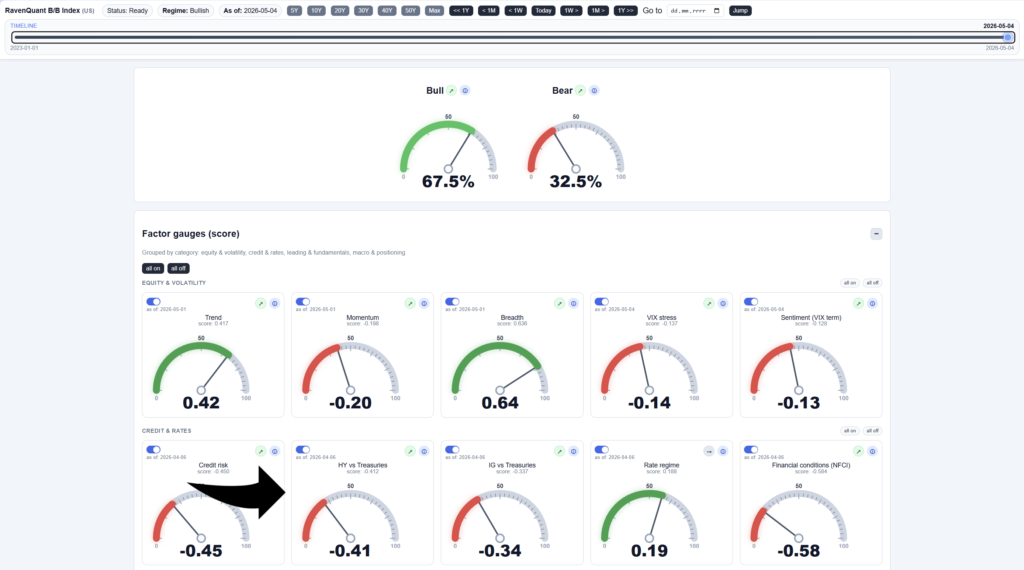
In the live RavenQuant B/B Index, the relevant rates-and-credit factor here is HY vs Treasuries spread (hy_tsy_spread), not the standalone 10-year yield. The 10-year level still provides macro context, but the spread itself is what directly captures changing credit risk appetite and contributes to the composite score.
Explore the live index here: https://bull-bear-analyzer-production.up.railway.app