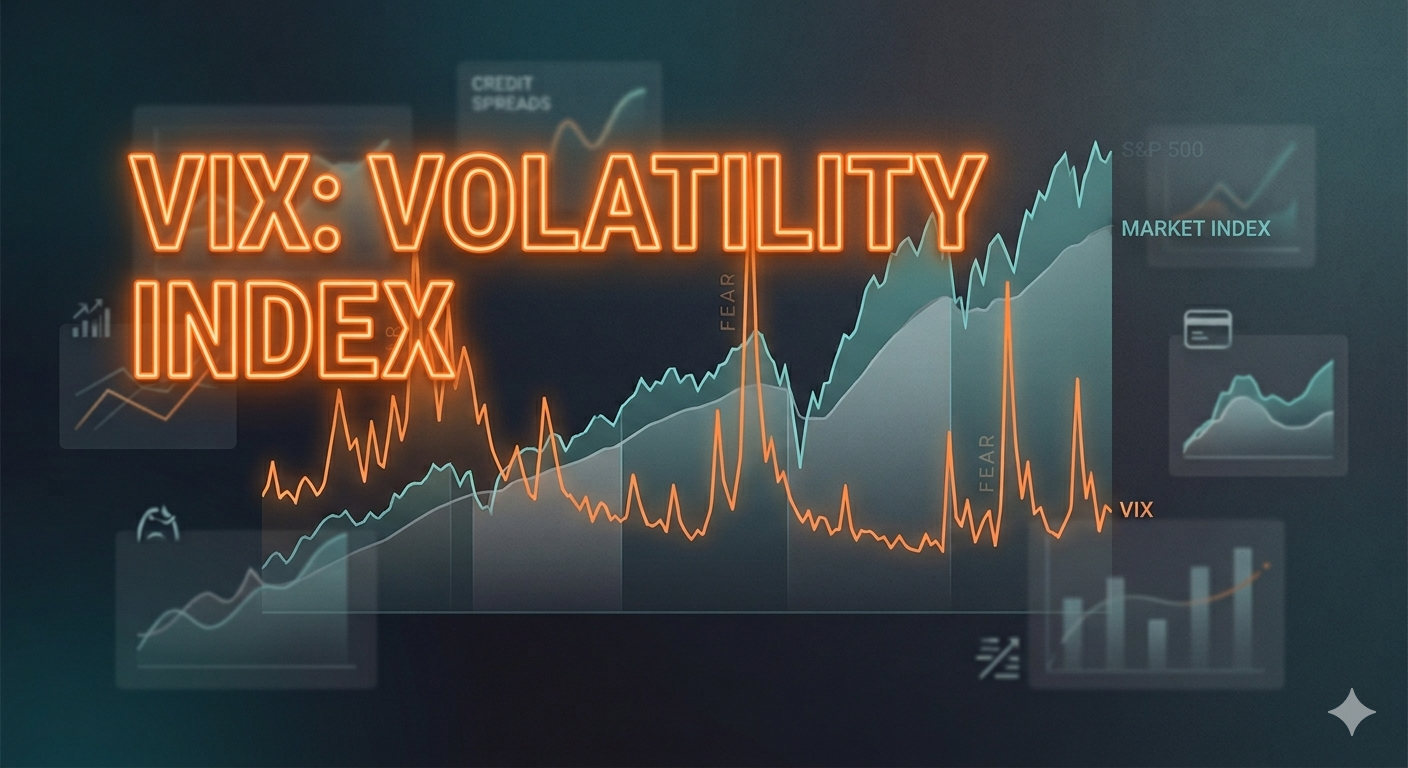
There’s a particular kind of market day where you almost don’t need to look at a ticker. You can feel it. Bid-ask spreads widen, volume floods into put options, and a number called the VIX starts printing values you haven’t seen in years. That number is the CBOE Volatility Index, and for the past few decades it’s become shorthand for market fear itself. Reading the VIX and understanding what it actually measures — and what it doesn’t — is one of the more useful things a serious market participant can do.
CHECK IT OUT
CHECK RQ B/B INDEX
What the VIX actually measures
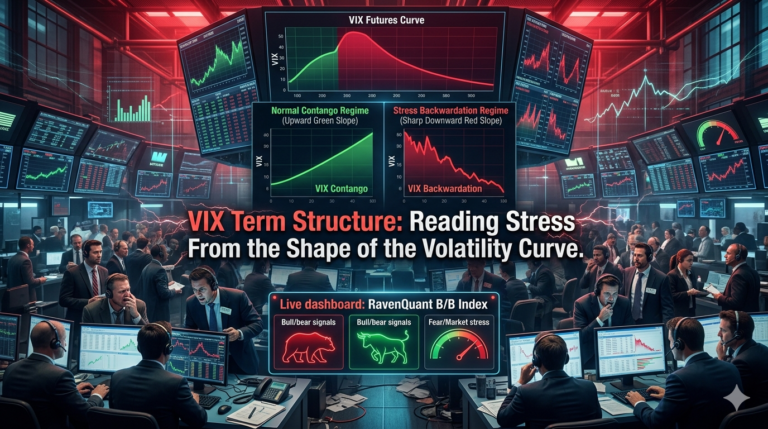
The VIX is not a price. It’s not a sentiment survey. It’s a measure of implied volatility derived from the prices of S&P 500 options — specifically, a weighted blend of options expiring across the near-term horizon that targets a 30-day forward-looking view.
When options traders are paying up for puts — protective contracts that profit if the market falls — the implied volatility embedded in those contracts rises. The VIX aggregates that across a broad range of strike prices into a single annualized number. A VIX reading of 20, for example, implies that the market is pricing in annualized volatility of 20%, or roughly a daily move of about 1.25% in either direction.
The CBOE publishes VIX data publicly and has backward-reconstructed it to 1990. This gives analysts a solid 35-year track record to work with.
The crucial thing to understand: the VIX measures expected volatility, not realized volatility. It’s forward-looking in the sense that it reflects what options market participants are collectively paying to hedge or speculate over the next month. When fear rises, options prices rise, VIX rises. When markets are calm and institutional players feel comfortable, those same options get cheaper, and VIX drifts lower.
Reading the VIX levels in regime context
The signal works best when you think of VIX levels in a historical context. A VIX below 15 has historically corresponded to calm, low-stress market environments where equities tend to grind higher. These are periods like mid-2017, late 2019, and much of 2021 — when institutional investors aren’t paying premium prices to hedge because they don’t feel particularly threatened. From a regime perspective, that’s a comfortable backdrop.
When the VIX climbs above 25–30, it typically signals that something real is bothering the market — deteriorating macro data, a credit event, a geopolitical shock. Above 40, you’re in genuine stress territory. And the times VIX has crossed 50 or higher have been associated with some of the most significant market dislocations in modern history.
The inversion is worth understanding explicitly: high VIX is a bearish signal, low VIX is a bullish one. This is intuitive once you think about it — elevated fear in options markets is a symptom of stress, not of health. Regime analysis that incorporates VIX treats it this way: a low, stable VIX is a supportive backdrop for equities; a high or rapidly rising VIX is a warning that the market’s stress level has changed.
When the fear gauge truly spikes
The two largest VIX spikes on record both occurred during systemic crises, and understanding them helps calibrate what “elevated” actually means.
During the 2008 financial crisis, the VIX reached an intraday high of 89.53 on October 24, 2008, as Lehman Brothers had already collapsed and the banking system was facing questions about solvency that seemed almost unanswerable at the time. The sustained period of elevated VIX — averaging 32.69 for the full year 2008 and remaining near those levels through most of 2009 — was itself a macro regime. This wasn’t a spike and recovery. It was months of persistent, grinding fear.
March 2020 briefly eclipsed it. The highest VIX close on record is 82.69, reached on March 16, 2020, as COVID-19 lockdowns spread globally and the economic implications of a forced shutdown of vast portions of the economy became impossible to ignore. Remarkably, that spike was short-lived relative to 2008. The Fed moved faster in 2020, and by the summer the VIX was back in the 20s.
August 2015 brought another spike, when a sudden devaluation of the Chinese yuan triggered a global growth scare and the VIX jumped to an intraday high of 53.29 on August 24 — the so-called “flash crash” day. Again, that spike reversed relatively quickly, a useful reminder that not every fear event becomes a prolonged bear market.
August 2024 added a more recent data point: on August 5, following a combination of weak US jobs data and the unwind of yen-carry trades, the VIX briefly broke above 65 intraday — its highest level since the COVID crisis. The market had largely recovered within weeks.
Why VIX isn’t a timing tool on its own
Here’s the limitation that every serious practitioner knows: the VIX tends to spike at or near market lows, not at tops. By the time the VIX is printing 50 or 60, the carnage in equities is already well advanced. You’re not getting a warning — you’re getting a confirmation of what the market has already done to you.
This makes the VIX tricky to use as a tactical buy/sell signal on its own. The March 2020 VIX spike of 82.69 coincided almost perfectly with the S&P 500 bottom. In hindsight, it was a screaming buy signal. But in real time, with uncertainty about the duration of the pandemic and the scope of economic damage, very few people were positioned to act on it. The same dynamic played out in October 2008 — the VIX kept climbing even as the market was approaching levels that would, eventually, represent generational buying opportunities.
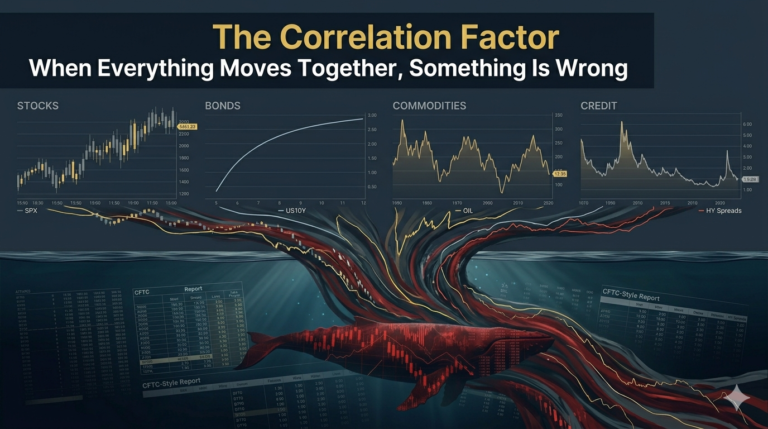
What VIX does more reliably is help classify the current regime. When it’s elevated and rising, you’re in a stressed environment where risk assets tend to underperform, volatility in both directions increases, and correlations across asset classes often spike toward 1. When it’s low and stable, conditions are more favorable. Using the VIX as one piece of a multi-factor regime picture — rather than the whole picture — is where it delivers real analytical value.
VIX inside a broader regime framework
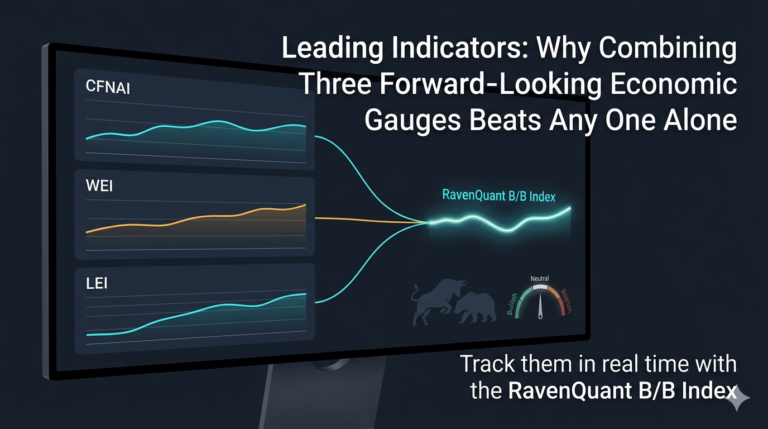
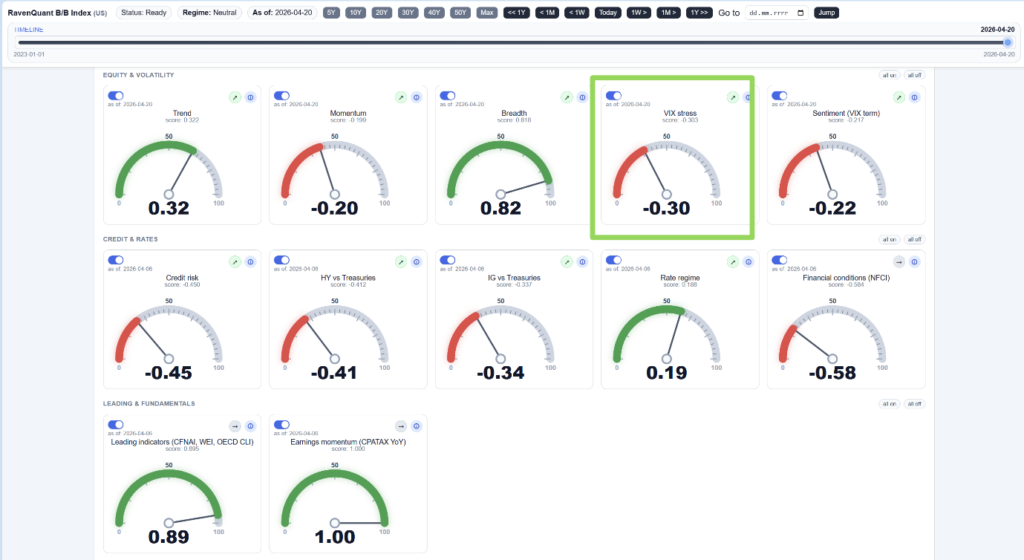
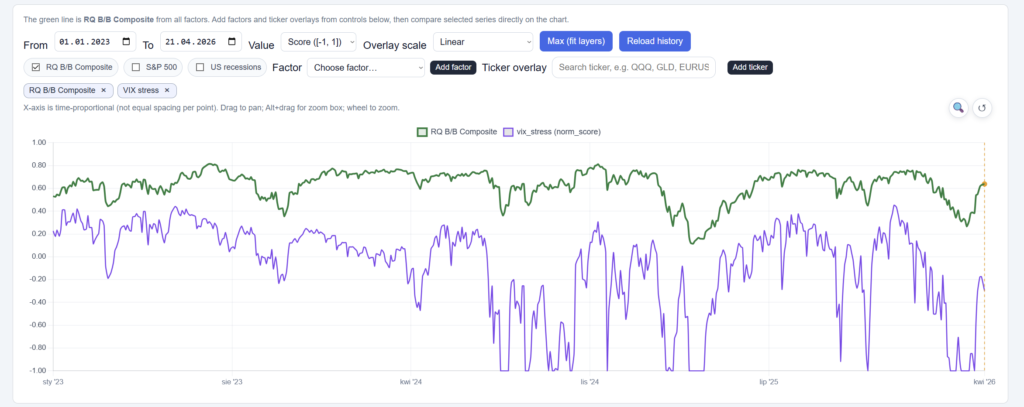
If you want to see how VIX stress is currently reading and whether fear has been building or dissipating over recent weeks, it’s one of the inputs tracked in the RavenQuant B/B Index — the 20-day trend direction adds context the raw number alone can’t provide.
How RavenQuant B/B Index scores the VIX stress factor
The RavenQuant Bear/Bull Index does not treat the VIX as a simple on/off rule such as “above 20 = fear.” The VIX stress factor is a continuous score: today’s VIX is compared to its own recent distribution (median and dispersion over roughly one year of trading days), then mapped into [-1, +1] so it can be combined with the other sixteen factors.
Raw signal. Let VIX be the CBOE Volatility Index level (spot implied volatility on the S&P 500). The model stores that level as the raw series:
vix_stress_raw = VIX
So the raw input is literally the published VIX index, not a derived basket.
Normalization (robust z, then sign flip). Over a rolling window of 252 trading days (about one year), with at least 60 days required before scores stabilize, the code builds a robust z-score of VIX: deviation of today’s VIX from the rolling median, scaled by a robust spread (MAD-based, with the usual 1.4826 factor so it lines up with a normal scale). That z-score is divided by 3, clipped to [-1, +1], then multiplied by -1:
vix_stress_score = – clamp( robust_z(VIX) / 3 , -1, +1 )
Interpretation. Because of the leading minus sign, high VIX relative to its own recent norm pushes the factor toward negative scores (stress / risk-off tilt in the composite). Unusually low VIX relative to that rolling history pushes it toward positive scores (calm / complacency side). The factor is not “high VIX = +1” — it is stress-sensitive in the direction that hurts bulls when fear spikes, consistent with treating volatility as a cost of risk, not a buy signal by itself.
Approximate tiers (interpretation, not separate rules in code):
- +1.0: VIX is extremely low vs its own trailing-year distribution (roughly the calm tail of the robust z, before clipping).
- +0.5 to +0.7: VIX is materially below its rolling “typical” range — persistent calm / complacency regime in relative terms.
- +0.2 to +0.4: VIX is modestly below median — normal-to-quiet volatility.
- 0.0: VIX is near the rolling median in robust-z terms — “typical” stress reading for that window.
- -0.2 to -0.4: VIX is elevated vs its recent norm — caution / early stress.
- -0.5 to -0.7: VIX is high vs its recent norm — clear risk-off / fear pressure in relative terms.
- -1.0: VIX is at an extreme high vs its trailing-year distribution (panic tail, before clipping).
Absolute VIX prints (e.g. 15 vs 30) are not hard thresholds in the code; the same VIX level can score differently after a long calm stretch vs after a long volatile one, because the benchmark is rolling.
Composite weight. The VIX stress factor has a weight of 12% in the default RavenQuant composite — a major risk-regime input alongside trend and credit, but not the single largest slice.
Composite blend. The composite then blends all factor scores (including VIX stress) into sentiment_score, maps that to p_bull and p_bear, and assigns Bullish / Neutral / Bearish labels at the index level using thresholds on p_bull (not on the VIX stress score alone).