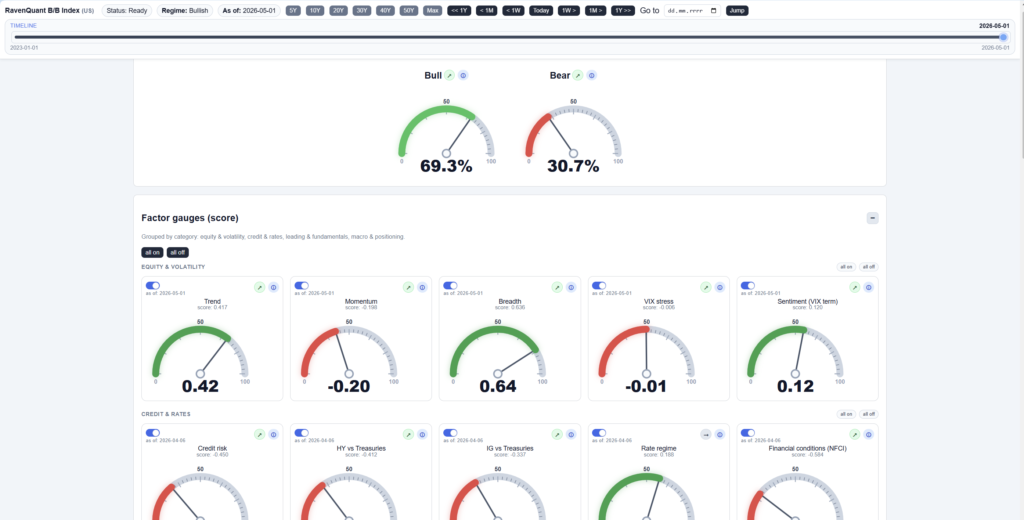
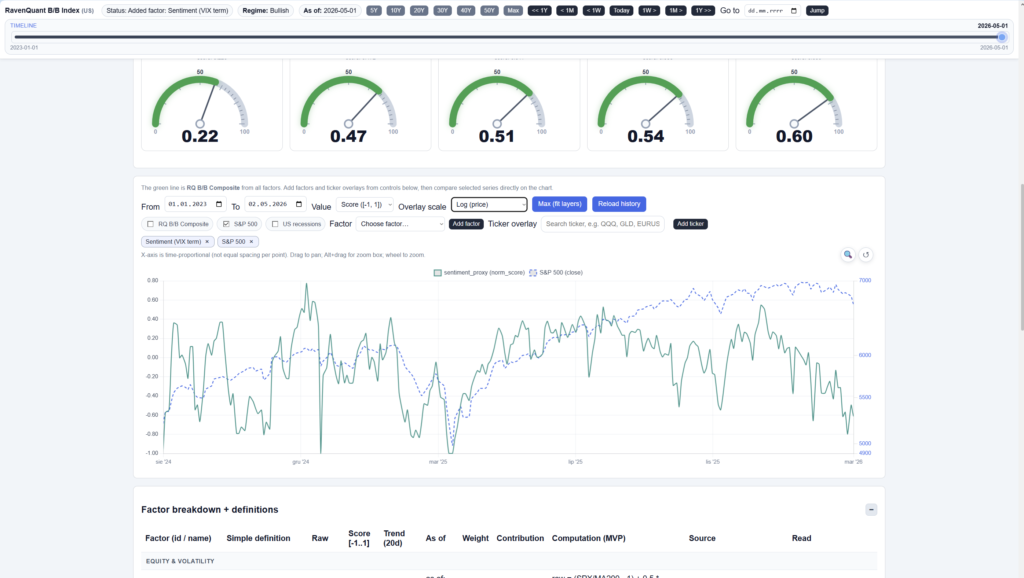
Live dashboard: RavenQuant B/B Index
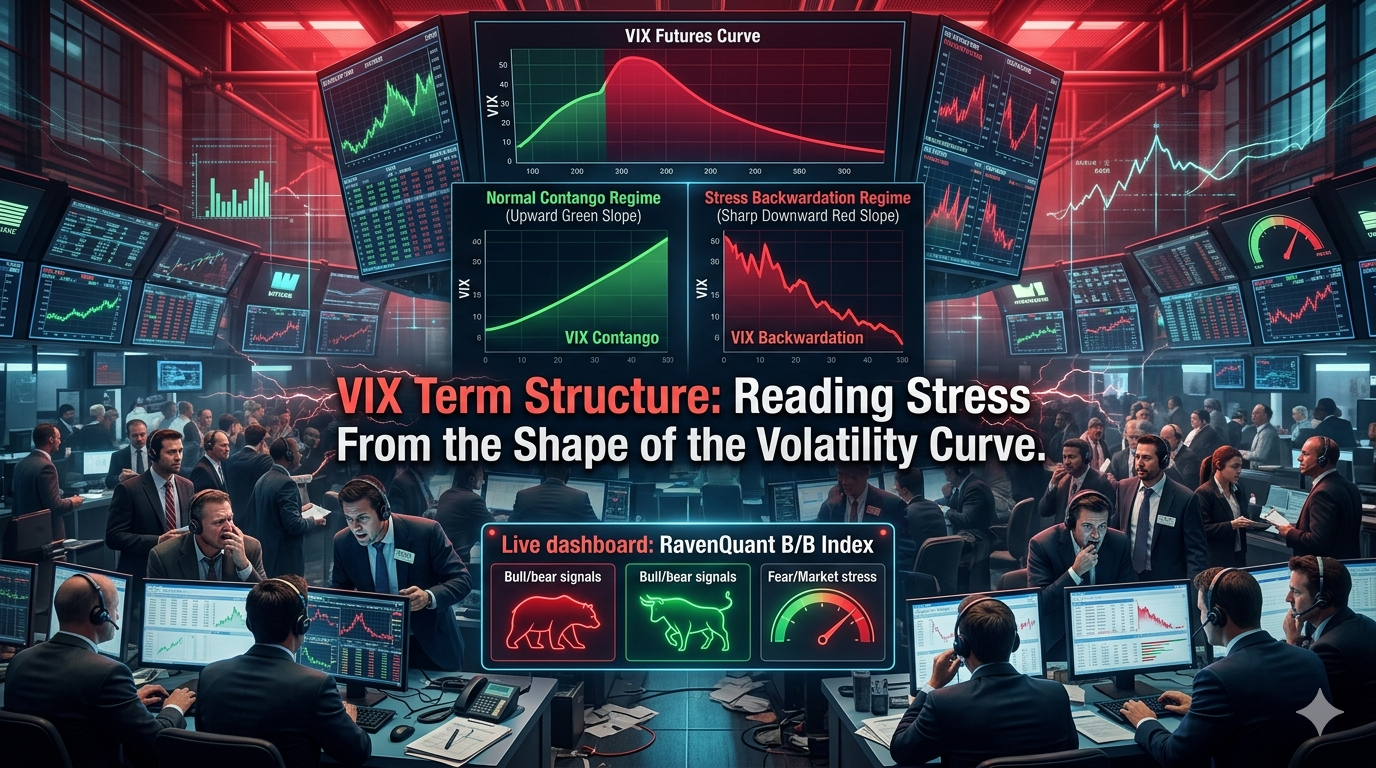
VIX Term Structure is a key market regime signal for investors. Most market participants know what the VIX is – the CBOE Volatility Index, often called the “fear gauge,” measuring the market’s expectation of 30-day implied volatility on the S&P 500. When the VIX spikes above 30 or 40, everyone notices. But there’s a more nuanced version of this signal that many traders overlook: not just where the VIX is, but what shape the volatility curve takes across different time horizons. A VIX reading of 20 can mean two very different things depending on whether the volatility curve is sloping upward or inverted – and that difference carries real information about the kind of stress the market is actually pricing in.
Contango, Backwardation, and What They Signal About Risk
The standard VIX measures 30-day implied volatility – the options market’s expectation of how much the S&P 500 will move over the next month. VIX3M (also written as VIXMO or tracked as ^VIX3M on Yahoo Finance) measures 93-day implied volatility – the market’s expectation for the next three months. Both are calculated by CBOE using S&P 500 options data.
The ratio VIX3M/VIX – 1 tells you the slope of the volatility curve: how much more (or less) is the market pricing for three-month risk compared to one-month risk. When this ratio is positive, the curve is in contango – longer-dated volatility is priced higher than near-term volatility. When it’s negative, the curve has inverted into backwardation – near-term fear is so elevated that it’s actually priced above longer-horizon uncertainty.
How to Read Stress Transitions Before Volatility Spikes
It’s worth being clear about base rates here. According to CBOE’s own analysis, the VIX futures curve has been in contango more than 80% of the time since 2010. This makes intuitive sense: volatility is mean-reverting, and elevated near-term fear tends to subside over time. So markets naturally price three-month volatility higher than one-month volatility as a structural feature, not an anomaly. Contango is normal. Backwardation is the signal.
In a contango environment, even at moderate VIX levels – say, 18 or 20 – the term structure is telling you that traders expect near-term uncertainty to resolve. The market may be jittery, but it’s pricing in a normalization scenario. That’s a meaningfully different context than the same VIX level in backwardation.
Case Study: Volatility Shock, Inversion, and Normalization
Here’s the key insight that makes term structure analysis genuinely useful: a VIX of 20 in contango and a VIX of 20 in backwardation are completely different situations. In contango at 20, markets are mildly elevated but forward-looking; traders think the uncertainty is temporary. In backwardation at 20, near-term fear has overwhelmed longer-term expectations – markets are pricing chaos right now, not a gradual normalization.
This distinction becomes even more important at higher VIX levels. When the VIX spikes to 35 or 40 and the term structure simultaneously inverts into deep backwardation, it’s a marker of acute systemic stress – the kind where near-term fear is so extreme that it dwarfs any expectation of medium-term stability. Identifying that state matters because it often corresponds with forced selling, margin calls, and the kind of dislocations that create both extreme risks and, eventually, extreme opportunities.
On August 24, 2015, U.S. equity markets opened with violent dislocations. The Dow Jones fell over 1,000 points in the first minutes of trading, and the VIX spiked to approximately 53 intraday – one of the highest readings since the 2008 crisis. The volatility term structure briefly inverted into sharp backwardation, signaling that near-term fear had become genuinely acute. However, the move proved short-lived; the VIX retreated rapidly, and the term structure returned to contango within days as the immediate shock absorbed.
This pattern – sharp backwardation spike followed by rapid normalization – is actually the characteristic signature of what might be called a genuine volatility event as opposed to a slow grind. When backwardation appears and resolves quickly, it often marks an exhaustion of near-term fear. When it persists for weeks or months, it’s a different and more troubling story.
Why Long Volatility ETPs Decay in Contango
If you’ve ever wondered why products like VXX – the iPath S&P 500 VIX Short-Term Futures ETN – tend to bleed value over time in calm markets, the term structure explains it entirely. VXX holds a rolling position in near-term VIX futures. In a contango environment (which, again, describes the majority of trading days), each roll from the expiring near-term contract to the next one costs money – you’re buying the more expensive, longer-dated contract and selling the cheaper near-term one. This roll yield drag is a structural feature of long volatility products in normal markets.
Backwardation flips this dynamic. When near-term futures are more expensive than longer-dated ones, rolling the VXX position creates a positive roll yield – long volatility products benefit. Understanding this is essential for anyone trading volatility ETPs, and it’s one reason the term structure signal has genuine informational content beyond just measuring fear.
How RavenQuant Integrates VIX Term Structure in Real Life
In the live RavenQuant B/B Index, VIX term structure is treated as a fast risk-regime signal rather than a stand-alone trigger. Persistent healthy contango supports a constructive risk score, while flattening and especially sustained backwardation reduce that score and raise defensive weighting because they indicate near-term stress is overtaking medium-term expectations. This gives the model an early-warning layer for stress transitions before broader macro indicators fully react.
How to Track and Interpret the Signal
The ratio is straightforward to calculate manually. CBOE publishes both VIX and VIX3M data, and ^VIX3M is accessible on Yahoo Finance. Divide VIX3M by VIX, subtract 1, and you have the raw slope reading. Positive values mean contango; negative values mean backwardation. Because this factor can move faster than most macro-based signals, watching the direction of change matters as much as the absolute level – a regime that was in healthy contango last week but is now moving toward flatter or inverted territory is worth watching even before the raw score crosses into negative territory.
For a deeper dive into the mechanics of contango and backwardation in volatility markets, CBOE’s own analysis of VIX backwardation is worth reading.
RavenQuant B/B Index
Explore the live index here: https://bull-bear-analyzer-production.up.railway.app