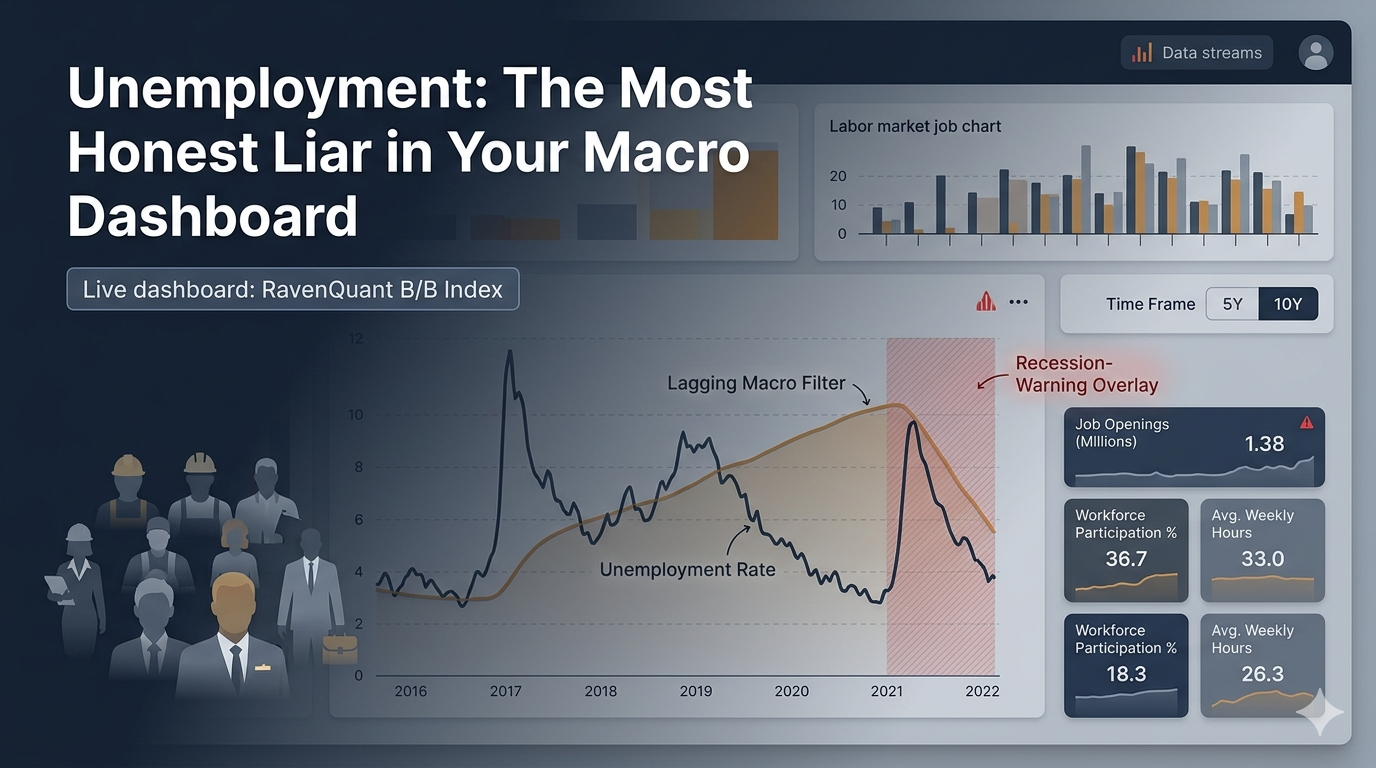
Live dashboard: RavenQuant B/B Index
There is a particular cruelty to unemployment data that most people never think about. By the time the headline unemployment rate is rising fast enough to worry about, the damage has usually already been done. Markets have already moved. The recession has already started, and in some cases is nearly over. And yet, the unemployment rate is still one of the most watched numbers in all of macroeconomics. Understanding why — and especially when — it matters is the key to using it correctly.
Why Labor Data Lags but Still Validates Regime Shifts
The unemployment rate is what economists formally classify as a lagging indicator. This is not a criticism — it is a feature of how the labor market actually works. Companies do not fire people at the first sign of trouble. They cut hours, freeze hiring, cancel contractors, and defer capital projects first. Full layoffs are expensive, legally complex, and often come after the business has exhausted every other option.
This means that by the time the unemployment rate registered by the Bureau of Labor Statistics UNRATE series shows a meaningful uptick, you are looking at a reading that reflects decisions made weeks or months earlier. The slowdown has been happening. The rate is just now confirming it.
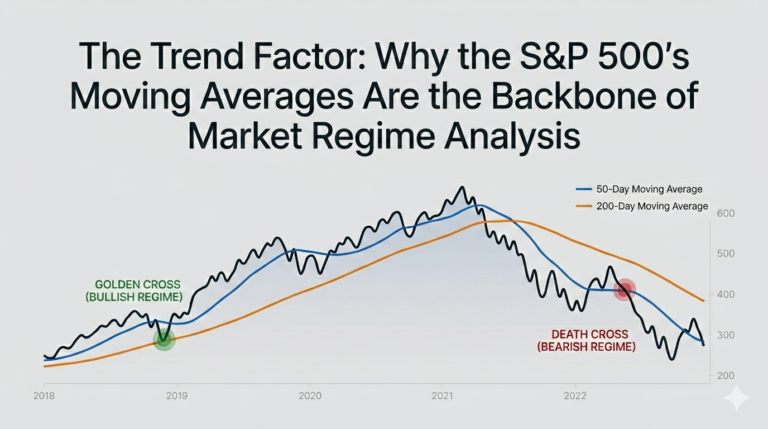
The classic historical example of this dynamic is pre-2008. Unemployment sat at 4.4% in May 2007 — perfectly healthy by any historical standard. And yet the U.S. housing market was already cracking, the subprime mortgage securitization machine was grinding to a halt, and the credit markets were starting to show signs of stress that would eventually detonate the global financial system. If you had anchored your macro view to the unemployment rate in early 2007, you would have missed the entire warning period before the worst financial crisis since the Great Depression.
How to Read the Unemployment Trend Without Overreacting
Not all unemployment analysis is created equal. Former Federal Reserve economist Claudia Sahm developed a much more useful approach: instead of looking at the absolute level of unemployment, look at the rate of change relative to a recent low.
The Sahm Rule works as follows: if the three-month moving average of the unemployment rate rises 0.5 percentage points or more above its lowest reading over the prior twelve months, the U.S. economy has likely entered a recession. This is available on FRED as the SAHMREALTIME series, and it is updated monthly.
The reason this is more useful than the raw rate is that it catches the turning point — the shift from a stable labor market to a deteriorating one — before the deterioration becomes obvious. Rather than waiting for unemployment to hit 6% or 7%, the Sahm Rule can fire at 4.2% if the trajectory is right.
This indicator briefly triggered in the summer of 2024, when the three-month average crossed the 0.50 threshold in July and August, reaching 0.57 in August 2024 before retreating below the threshold in subsequent months. It was a notable moment — widely covered in financial media and prompting considerable debate about whether a recession was beginning or the signal was a post-pandemic statistical anomaly driven by labor supply expansion rather than weakening demand.
How Unemployment Data Is Weighted in the RavenQuant B/B Index
If you want to understand how extreme unemployment moves can get, nothing compares to what happened in March and April of 2020. The unemployment rate went from 3.5% in February to nearly 15% in April — the fastest and largest surge ever recorded in the modern series. For context, the Great Recession peak was around 10%.
And here is the thing: equity markets bottomed in late March 2020, before unemployment even began to show that catastrophic rise in the official data. The S&P 500 had already found its low and started recovering by the time April’s unemployment figures were released. Investors who were waiting for unemployment to confirm their view were buying at much higher prices than those who responded to other signals — credit spreads, positioning data, Fed action — that moved faster.
The best way to think about unemployment in a macro framework is as a backstop. If the unemployment rate is rising sharply and the Sahm threshold has been crossed, you are probably not wrong to be cautious about equities even if other signals seem mixed. When employment deteriorates enough to show up visibly in the official data, the macro environment has almost certainly shifted into something more serious than a standard short-term correction.
But if unemployment is low and steady, do not take that as permission to ignore warning signs in faster-moving indicators. The market rarely waits for unemployment to confirm a problem before pricing it in.
Unemployment data’s main structural weakness is its release schedule and inherent lag. It is published monthly by the Bureau of Labor Statistics, always reflecting decisions made well before the release date. The headline UNRATE also masks significant variation in labor market quality — it counts a part-time worker as employed the same way it counts a full-time one, and it excludes discouraged workers who have stopped looking entirely. The broader U-6 measure captures some of this, but it rarely gets the same headline attention. The Sahm Rule improves on the raw rate considerably, but even it has generated false signals, most notably in 2024, when the brief threshold breach appeared to reflect an unusual expansion of the labor supply rather than genuine demand-side deterioration.
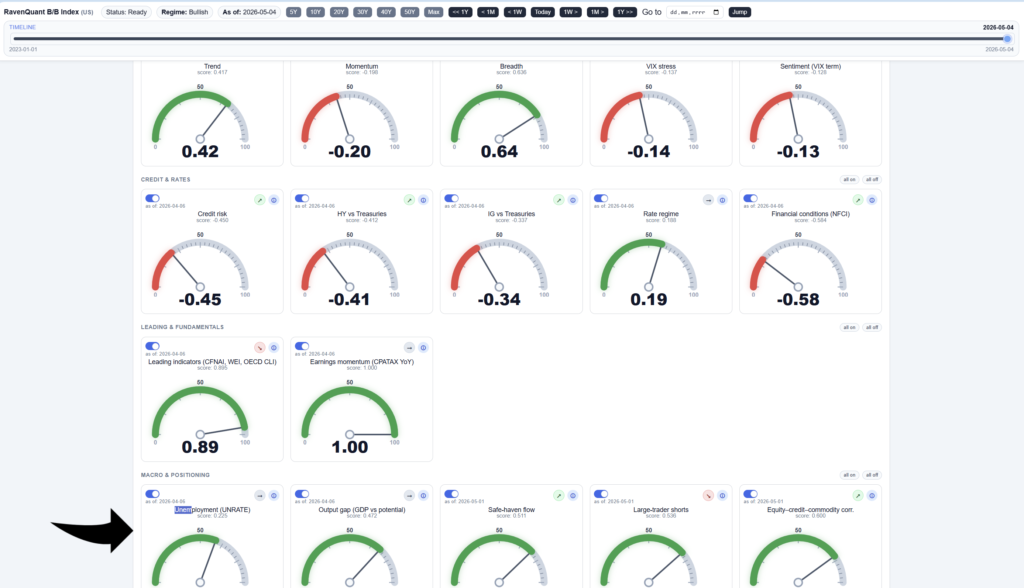
The unemployment factor — drawing from the UNRATE series on FRED, updated monthly by the Bureau of Labor Statistics, with Sahm Rule logic embedded in how the signal is scored — is included in the RavenQuant B/B Index at ravenquant.com. If you want to see how the current labor market trajectory is reading alongside faster-moving macro signals, it is tracked there.
Explore the live index here: https://bull-bear-analyzer-production.up.railway.app