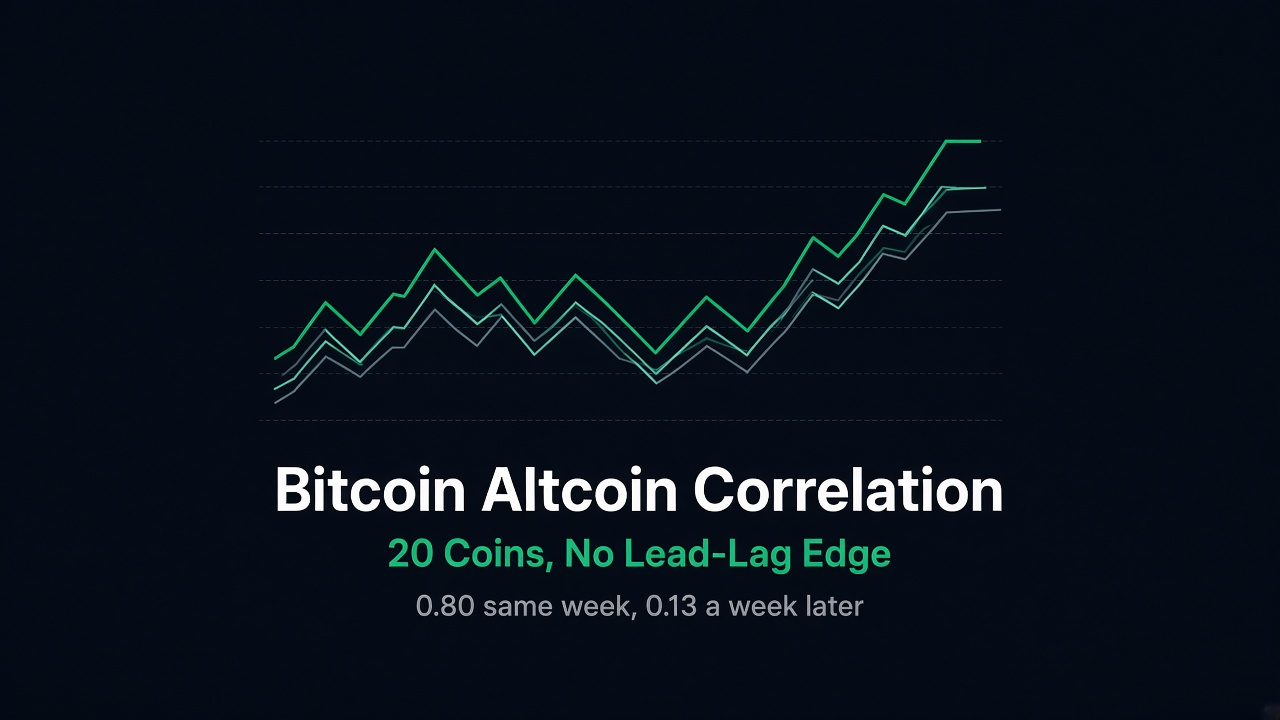
Bitcoin altcoin correlation is the number behind most crypto advice, and I rarely see it measured on more than a handful of coins. “Alts follow BTC” is easy to agree with. The stronger version is the one people trade: Bitcoin moves first, the alts catch up a few days later, so you buy the laggards. I wanted to see how much of that survives a plain test on 20 coins and nine years of prices.
I took the 20 largest altcoins by market cap on 17 November 2026, after dropping Bitcoin itself, stablecoins, tokenized gold and treasuries, and wrapped or staked versions of BTC and ETH. For each coin I pulled daily closes and computed daily and weekly log returns (weeks run Sunday close to Sunday close). Then I measured how closely each coin and an equal-weight basket of all 20 move with BTC in the same period, whether BTC’s move this week predicts the alts’ move next week, whether that changed over time, and what happens if you turn the idea into a rule.
The article has two parts. First, the measurement: how closely the alts follow Bitcoin and whether Bitcoin moves first. Second, deliberately simple strategies to test that idea in practice. One uses Bitcoin’s previous daily move: after each UTC daily close I hold the alt basket for a day depending on whether BTC went up or down. The other uses the hourly SuperTrend on BTC (ATR 10, multiplier 3.0): on every flip I reverse a 2x position in each alt, with fees. If alts really lag Bitcoin, either signal should help.
Basket vs BTC, weekly
0.80
equal-weight 20 alts, 470 weeks
Median single coin
0.61
weekly, from 0.17 (LEO) to 0.79 (ETH)
BTC leads by 1 week
0.13
explains 1.8% of next week’s alt move
SuperTrend on alts, 2x
17 of 18
ended below $50 from $1,000
Bitcoin altcoin correlation: 20 coins, same week
Start with the number everyone quotes. Taken together, the 20 alts behave like one asset that tracks Bitcoin.
| Equal-weight 20-alt basket vs BTC | Periods | Correlation | R squared | Beta |
|---|---|---|---|---|
| Daily returns | 3,295 | 0.81 | 0.66 | 0.97 |
| Weekly returns (Sunday to Sunday) | 470 | 0.80 | 0.64 | 1.04 |
A correlation of 0.80 means Bitcoin’s return explains about 64% of the basket’s weekly variance. The beta of 1.04 says that for every 1% BTC moved, the basket moved about 1.04% in the same week. That is close to a one-for-one copy, not the leveraged bet people often describe.
The basket is stronger than the typical coin, and the reason is averaging. Twenty coins cancel out most of their own noise. A single alt is much looser: the median coin has a weekly correlation of 0.61, an R squared of 0.37, and a beta of 1.06. So roughly two thirds of a typical alt’s weekly movement has nothing to do with Bitcoin.
Weekly correlation of each coin with BTC. Lighter bars have under 250 weeks of data, so treat them as rough. Source: Yahoo Finance daily closes, Bybit for Hyperliquid, Uniswap and Sui.
The spread is wide. Ethereum (0.79), Monero (0.71), Litecoin (0.70) and Bitcoin Cash (0.68) are the closest. Ripple (0.53), Dogecoin (0.53) and Tron (0.54) are the loosest of the large old coins. The two exchange tokens, LEO (0.17) and WBT (0.33), barely track Bitcoin at all, which makes sense: their price follows an exchange, not the crypto market. If you count them as “alts”, they pull the average down.
Betas show who moves more than Bitcoin. Sui has the highest at 1.54, then Near (1.35), Avalanche (1.28), Solana (1.22), and Cardano (1.20). Monero (0.88) and Ripple (0.91) move less than Bitcoin when it moves. Sui has only 184 weeks of data, so its number can still shift.
Down weeks bind tighter than up weeks
Split the 470 weeks by whether Bitcoin went up or down. In the 226 down weeks the basket’s correlation with BTC was 0.77. In the 244 up weeks it was 0.55. Direction behaves the same way: the alt basket was up in 82% of the weeks Bitcoin was up, and the two had the same sign in 81% of all weeks, against a base rate of 52% for an alt up week. On average the basket gained 7.3% in weeks BTC rose and lost 6.8% in weeks it fell.
My reading, and it is only a reading, is that in a sell-off everything gets sold together, while in a rally the coins separate and chase their own stories. If you hold a basket of alts to diversify away from Bitcoin, the weeks you most want that diversification are the weeks it shows up least.
Is the correlation fading? Rolling 90 days and four eras
A common claim is that alts “decoupled” from Bitcoin as the market matured. The rolling 90-day correlation of daily returns does not show it. The median is 0.86, the 10th percentile 0.72, the 90th percentile 0.93. The lowest reading in nine years is 0.57 and the highest 0.97. It has not been below 0.5 once.
Splitting the weekly data into eras gives the same picture. The first era has only about a dozen coins, because that is how many of today’s top 20 were trading in late 2017, so it is the roughest.
| Era | Weeks | Same-week r | Beta to BTC | BTC leads by 1 week | Alts lead BTC by 1 week |
|---|---|---|---|---|---|
| 2017 to 2019 | 111 | 0.79 | 1.09 | 0.12 | -0.10 |
| 2020 to 2021 | 104 | 0.77 | 0.96 | 0.22 | +0.01 |
| 2022 to 2023 | 105 | 0.83 | 0.92 | 0.08 | +0.12 |
| 2024 to 2026 | 150 | 0.86 | 1.13 | 0.03 | +0.07 |
The same-week correlation did not fall. It was 0.79 in 2017 to 2019 and 0.86 in 2024 to 2026, with the basket beta at 1.13 in the latest era. The one-week lead column is where the change shows up. It peaked in 2020 and 2021 at 0.22, which was the stretch when alts ran after Bitcoin’s breakout, and it has collapsed to 0.03 since 2024. I cannot test eras before 2017, because only Litecoin has daily prices that far back.
Does Bitcoin lead? The lead-lag test
This is the part that matters for trading. Correlation in the same week cannot be traded, because by the time you see Bitcoin’s weekly close the alts have already moved. Only a delay would give you something to act on. So I shifted Bitcoin’s return back by one to eight weeks and correlated it with the alt basket’s return, and I did the reverse to see whether alts lead Bitcoin.
The same-week bar is the only large one. Next to it, BTC leading by one week shows 0.13, which is 1.8% of variance. The next three lags read 0.04, 0.11, and 0.10. That is not a fading echo: lag 3 is larger than lag 2. The alts-lead-BTC side sits near zero from one to three weeks (about -0.01 to +0.01) and dips to -0.08 at four weeks. Further out it wanders between -0.09 and +0.08 with no pattern.
With 470 weeks the standard error of a correlation is about 0.05, so 0.13 is a bit under three standard errors and 0.10 about two. When you test 16 lags, one or two of them will clear two standard errors by luck alone. At daily frequency it is the same story. BTC leading by one day reads -0.05, by two days +0.06, and by 3, 5, 7, and 14 days between -0.01 and +0.03. Nothing at the daily level explains more than 0.4% of the variance.
What the lead looks like in plain numbers
Sort the 470 weeks into five groups by Bitcoin’s return, worst fifth to best fifth, and look at what the alt basket did that week and the week after.
| BTC week, worst to best fifth | Weeks | BTC that week | Alt basket that week | Alt basket next week |
|---|---|---|---|---|
| Q1 | 93 | -12.2% | -13.5% | -1.2% |
| Q2 | 94 | -2.5% | -2.7% | +0.4% |
| Q3 | 94 | +0.4% | +0.9% | +0.4% |
| Q4 | 94 | +4.0% | +5.3% | -1.1% |
| Q5 | 94 | +12.8% | +12.5% | +3.9% |
The same-week column is almost one for one. The next-week column is where a lead would show, and it is mixed. After Bitcoin’s best weeks (an average of +12.8%) the alts made +3.9% the following week. After its worst (-12.2%) they lost 1.2%. But the second fifth is positive, the fourth is negative, and the whole pattern is not monotone. The era table above suggests most of the top-fifth effect comes from 2020 and 2021, though I did not split the groups by era. On daily data the next-day alt return in each fifth stays between -0.14% and +0.54%, with no ordering.
Direction tells the same story. Whether Bitcoin was up or down this week matched the alt basket’s direction next week 50.4% of the time. After an up week for BTC, the alts rose the next week 52.5% of the time, against 52.1% across all weeks. The average next-week alt return was +1.2% after a BTC up week and -0.2% after a down week. That gap is the 0.13 correlation in plain numbers, and it is small next to alt swings of 5 to 13% either way.
I also ran the plain regression version, predicting the basket’s weekly return from the past. Bitcoin’s return in the same week gives an R squared of 64%. Bitcoin’s return from the week before gives 1.9%. The basket’s own previous week gives 0.7%, and both together give 2.1%. Bitcoin’s own weekly return has an autocorrelation of 0.06. There is very little memory in any of these series.
Can you trade the daily lead?
The daily test above only measures correlations, so I also ran it as a trading rule. The setup is the simplest one I could think of. At the UTC daily close I look at Bitcoin’s return for that day, then hold the equal-weight 20-alt basket for the next day, from that close to the next. The position is 1x, rebalanced daily, with a 4 basis point fee per side whenever it changes. Start capital is $1,000, the period is November 2017 to November 2026 (3,294 days), and I left out funding and slippage. I also assume I can trade at the daily close, which flatters every rule. I tried six: follow BTC (long alts after an up day, short after a down day), the reverse, long only after up days, long only after down days, long only after BTC’s worst fifth of days (a fall of 1.7% or more), and long only after its best fifth (a gain of 2.1% or more). I judge each rule on its own: its t-stat, its drawdown, and whether it holds up in every era. I do not compare it with buying and holding, because that result depends too much on the start date and on the basket being today’s survivors.
| Daily rule on the alt basket, 1x | Days in market | $1,000 became | Per year | Worst drop | t-stat of daily return |
|---|---|---|---|---|---|
| Follow BTC (long after up, short after down) | 3,294 | $0.27 | -59.8% | -100.0% | -2.29 |
| Reverse BTC (short after up, long after down) | 3,294 | $862 | -1.6% | -91.4% | 1.12 |
| Long only after a BTC up day | 1,680 | $785 | -2.6% | -93.3% | 0.67 |
| Long only after a BTC down day | 1,614 | $37,853 | 49.6% | -64.4% | 2.98 |
| Long only after BTC’s worst fifth of days | 685 | $45,911 | 52.9% | -45.4% | 3.56 |
| Long only after BTC’s best fifth of days | 643 | $3,039 | 13.1% | -74.5% | 1.56 |
Following Bitcoin loses almost everything: $1,000 became $0.27, and the average day is negative (-16 basis points, t-stat -2.3). That fits the daily lag-1 correlation of -0.05. After a BTC up day the alt basket tends to give a little back, not follow through. The sign test says the same: after a BTC up day the alts rose the next day 52.0% of the time, against 53.8% on all days, and the average next-day move was -0.05% after an up day and +0.19% after a down day.
The other side shows something. Buying the alts after BTC’s worst days made $45,911, and after any down day $37,853, with t-stats of 3.56 and 2.98. On the days the worst-fifth rule was invested, the basket averaged about 68 basis points. That is a short-term bounce after Bitcoin’s sharpest drops, and the quintile table above hinted at it.
Three things stop me from calling it an edge. First, the two long-only rules that work are partly just exposure to a basket of today’s survivors that rose over the period, so some of the profit is drift, not signal. The cleaner test of the signal is the long and short pair. There the reverse rule, which holds the same bounce but also shorts after up days, made $862 with a t-stat of 1.1. Second, the bounce lives in the early years. For the worst-fifth rule the t-stat is 1.7 in 2017 to 2019, 3.2 in 2020 to 2021, and 0.9 in both 2022 to 2023 and 2024 to 2026. From 2022 on it made $1,819 with a 30% worst drop and a t-stat of 1.2 over 330 invested days: positive, but not distinguishable from luck. Third, I picked the fifths after looking at the quintile table and tried six rules. With that many tries, one clearing t = 3 happens by chance more often than you would think. At 2x the same rule shows $381,964 on paper with a 74% drawdown, and I would not read anything into that either.
Applied one coin at a time, the follow-BTC rule ended above $1,000 for 1 of the 20 coins (WBT, $1,126), and the reverse rule for 1 of 20 (Monero, $4,375). Coin by coin it looks like noise.
One coin with a longer history
Litecoin has daily prices from September 2014, which gives a look at the years before the alt boom. Its weekly correlation with Bitcoin was 0.73 in 2014 to 2016, 0.67 in 2017 to 2019, and 0.70 over the full period. The one-week BTC lead was -0.19 in 2014 to 2016, +0.11 in 2017 to 2019, and 0.07 over everything. One coin is one coin, but it says two things: the same-week link existed before the 2017 alt market, and the sign of the lead flips between periods.
How I checked these numbers
Yahoo’s crypto prices have quirks, so I rebuilt the same tests from Binance hourly candles for the 18 coins that trade there (LEO and WBT do not). The basket came out at 0.83 on daily returns and 0.80 on weekly returns, on a shorter window of 402 weeks. The median single coin was 0.62 weekly. The BTC lead over the following four weeks read 0.12, 0.06, 0.03, and 0.10. The conclusions did not move.
Single coins did move. Litecoin’s daily correlation was 0.68 on Yahoo and 0.77 on Binance, Cardano’s 0.64 and 0.71, Ripple’s 0.57 and 0.63. I did not settle which source is cleaner, so read any single-coin figure in this article to the first decimal, not the second.
Turning it into a rule: BTC SuperTrend flips applied to alts
If Bitcoin leads even a little, its hourly trend flip should help on alts. My SuperTrend indicator (ATR 10, multiplier 3.0) on BTCUSDT hourly candles flipped 1,661 times between 22 August 2017 and 15 November 2026, about 180 times a year, or once every two days.
The rule
On every flip I close the position and reverse it (long to short or short to long), filling at the next hourly open after the bar that flipped. I apply the same flip times to each alt. The position is 2x notional, the whole equity is staked on every trade, and profits compound. Fees are 4 basis points per side on the notional. Start capital is $1,000. If a single leg loses more than the 2x position can absorb (a 50% move against it), the book is bust. I left out funding, spread, slippage, and intra-trade liquidation. Every one of those would make the results worse, so the numbers below are the generous version.
The result
| Coin | First fill | Last fill | Trades | Win rate | $1,000 became |
|---|---|---|---|---|---|
| BTC | 22 Aug 2017 | 17 Nov 2026 | 1,661 | 37% | $126.95 |
| HYPE (under 8 weeks) | 27 Sep 2026 | 17 Nov 2026 | 31 | 35% | $533.27 |
| ETH | 22 Aug 2017 | 17 Nov 2026 | 1,661 | 39% | $33.23 |
| BCH | 30 Nov 2019 | 17 Nov 2026 | 1,318 | 41% | $10.73 |
| XMR (data ends Feb 2024) | 15 Mar 2019 | 20 Feb 2024 | 840 | 40% | $2.96 |
| SUI | 6 May 2023 | 17 Nov 2026 | 722 | 38% | $0.31 |
| BNB | 8 Nov 2017 | 25 Dec 2017 | 20 | 30% | $0 (busted) |
| XRP | 6 May 2018 | 1 Feb 2021 | 411 | 37% | $0 (busted) |
| SOL | 13 Aug 2020 | 17 Nov 2026 | 1,225 | 39% | under $0.01 |
| TRX | 14 Jun 2018 | 4 Dec 2024 | 1,112 | 41% | $0 (busted) |
| ZEC | 21 Mar 2019 | 17 Nov 2026 | 1,416 | 40% | under $0.01 |
| DOGE | 6 Jul 2019 | 28 Jan 2021 | 228 | 38% | $0 (busted) |
| LINK | 19 Jan 2019 | 17 Nov 2026 | 1,437 | 39% | under $0.01 |
| ADA | 18 Apr 2018 | 17 Nov 2026 | 1,563 | 38% | under $0.01 |
| XLM | 1 Jun 2018 | 17 Nov 2026 | 1,544 | 40% | under $0.01 |
| NEAR | 15 Oct 2020 | 17 Nov 2026 | 1,199 | 38% | under $0.01 |
| LTC | 13 Dec 2017 | 17 Nov 2026 | 1,620 | 40% | under $0.01 |
| UNI | 18 Sep 2020 | 24 Feb 2024 | 637 | 39% | $0 (busted) |
| AVAX | 24 Sep 2020 | 8 Feb 2021 | 70 | 26% | $0 (busted) |
Bitcoin itself ended at $127 after 1,661 trades with a 37% win rate. ETH ended at $33. Six alts (BNB, XRP, TRX, DOGE, UNI, AVAX) went bust, each from a single reversal leg that moved more than 50% against the position. Eight more finished below $1, and Monero, Bitcoin Cash, and ETH finished below $50. The only alt above $100 is Hyperliquid, with 31 trades in under eight weeks, which tells you nothing.
The fees explain part of Bitcoin’s result and none of the alts’. A round trip costs 0.16% of equity at 2x (two sides at 0.04%, on twice the equity), and over 1,661 trades that removes about 93% of whatever the gross result is. BTC at 2x with no fees would have ended at $1,831. At 1x it ends at $1,885 net and $7,122 without fees. So costs are a real problem for a system that flips every two days.
The alts fail for a different reason. Solana, Chainlink, Cardano, Dogecoin, and Zcash are wiped out at 2x even with zero fees. Even at 1x with no fees Solana ends at $0.16, Chainlink at $0.35, Cardano at $12, Zcash at $6.79, and Litecoin at $113.50. Ethereum is the exception at $8,823. The reason goes back to the first section. A typical alt shares 37% of its weekly variance with Bitcoin, so each reversal copies Bitcoin’s direction plus a large piece of noise that Bitcoin’s chart cannot warn you about. Reverse and stake everything on that more than a thousand times and the noise eventually lands on a leg that costs half your capital.
Maybe the flip exit is the problem: a fixed bracket
One fair objection is that exiting on the next flip is arbitrary. So I replaced the exit. The entry still happens on a BTC flip, in the flip’s direction, but the position now closes at a take-profit of +x% or a stop of -x% from entry, at 2x leverage, and any flips in between are ignored. I tried 10 widths from 5% to 50% on 18 alts, so 180 alt books plus Bitcoin at each width.
| Take-profit and stop | BTC trades | BTC hit rate | BTC $1,000 became | Alts ending above $1 | Median alt |
|---|---|---|---|---|---|
| 5% | 638 | 50% | $8.46 | 5 of 18 | $0.37 |
| 10% | 283 | 47% | $0.05 | 6 of 18 | $0.05 |
| 15% | 150 | 50% | $0.48 | 3 of 18 | $0.00 |
| 20% | 106 | 50% | $0.07 | 1 of 18 | $0.00 |
| 25% | 66 | 40% | $0.00 | 2 of 18 | $0.00 |
| 30% | 53 | 37% | $0.00 | 3 of 18 | $0.00 |
| 35% | 37 | 50% | $0.00 | 1 of 18 | $0.00 |
| 40% | 27 | 42% | $0.00 | 1 of 18 | $0.00 |
| 45% | 25 | 42% | $0.00 | 2 of 18 | $0.00 |
| 50% | 2 | 50% | $0.00 | 1 of 18 | $0.00 |
Out of 180 alt books, 25 ended above $1 and two ended above the $1,000 start. Both were Hyperliquid, at 15% and 20%, with four trades each. Bitcoin’s own hit rate sits between 37% and 50% at every width: after a flip, price reached the take-profit before the stop about as often as a coin toss. At the 5% width and 2x, each trade moves equity by about +10% or -10%. A 50/50 bet like that loses about 0.5% a trade through compounding alone, and the fees come on top. At 50% width a 2x stop is a total loss, so 17 of 18 books were wiped out within their first few trades. The bracket does not rescue the idea. It confirms the entry has no directional edge worth leveraging.
What this test does not prove
The biggest limit is survivorship. These are today’s 20 largest alts, not the top 20 at the time. Coins like EOS and IOTA were top-ten names in early 2018 and are not in this universe, because they fell out of the ranking. That flatters every long position on these coins, including the long-only daily rules. I do not know in which direction it moves the correlations.
The other limits are about data. Hyperliquid has 70 weeks of daily history and under eight weeks of hourly history, Sui 184 weeks, WBT 220, Uniswap 268, so their rows are thin. Monero’s hourly series ends on 20 February 2024, when it stopped trading on Binance, so its row covers a different window from the rest. LEO and WBT are missing from the SuperTrend test because Binance has no hourly data for them. The daily data starts in November 2017 for most coins, which skips the first ten months of that year, and the final daily point on 17 November 2026 can be a partial day.
The strategy test has its own limits. It uses one SuperTrend setting and one bracket family, and I did not tune either. A different setting could behave differently, though the lead-lag section gives little reason to expect a rescue. I tested an hourly flip rule and daily rules, but not an intraday lag of a few hours. A slower weekly version, long alts after a BTC up week and short after a down week, is a separate test that I have not run. The next-week gap of +1.2% against -0.2% is larger than the fees, but most of it sits in 2020 and 2021, and the lead in 2024 to 2026 is 0.03.
The honest verdict on bitcoin altcoin correlation
Alts move with Bitcoin, hard and for the whole sample. About 64% of a 20-coin basket’s weekly variance is Bitcoin, and the link tightens in down weeks, when it hurts most. If you hold alts for diversification away from Bitcoin, I would not count on it.
The lead-lag story is much weaker than the headlines. There is a small one-week lead, it is not stable across eras, it is nearly gone in 2024 to 2026, and the alts do not lead Bitcoin at all. Turning it into a BTC-signal trade lost nearly all the capital on 17 of 18 alts with the hourly SuperTrend, and following Bitcoin’s daily move lost almost everything on the basket, even though I left out most of the real-world costs. The one thing that did show up is a bounce in alts after Bitcoin’s worst days, mostly in 2017 to 2021, which is not significant afterwards. So the short answer to “is there a strategy in this”: no, not one I would trade. The hourly SuperTrend flips and the fixed brackets lose nearly everything, following Bitcoin’s daily move loses too, and the only rule that earns money, buying alts after Bitcoin’s worst days, rests on 2017 to 2021 and is not significant since. I would use Bitcoin’s trend as risk context for the alt book, not as an entry signal. The same pattern showed up in my test of technical analysis on 30 stocks: a rule that sounds logical, loses after costs, and survives mostly in the stories people tell about it.
If you prefer rules built on a single liquid index with fixed time windows, my intraday volatility breakout strategy is built that way. And if you are weighing a different kind of Bitcoin risk, I covered the cryptography side in Can AI break blockchain. Prices came from Yahoo Finance, the coin universe from CoinGecko, and the hourly check from Binance public data.
FAQ: bitcoin altcoin correlation
How correlated are altcoins with Bitcoin?
An equal-weight basket of the 20 largest altcoins had a correlation of 0.81 with Bitcoin on daily returns and 0.80 on weekly returns, from November 2017 to November 2026. A typical single coin is looser: the median weekly correlation was 0.61. The 90-day rolling correlation of the basket never fell below 0.57.
Does Bitcoin lead altcoins?
Only slightly. BTC’s weekly return explains 1.8% of the alt basket’s return one week later (correlation 0.13), and the lead was 0.03 in 2024 to 2026. Longer lags are not a clean decay: lag 3 and 4 read 0.11 and 0.10 while lag 2 reads 0.04. Alts do not lead Bitcoin either.
Do altcoins lag Bitcoin by a week?
On average they barely do. After a Bitcoin up week the alt basket rose the next week 52.5% of the time, against 52.1% for all weeks. The average next-week alt return was +1.2% after a BTC up week and -0.2% after a down week, mostly from 2020 and 2021.
Is the Bitcoin altcoin correlation getting weaker?
No. The weekly basket correlation was 0.79 in 2017 to 2019, 0.77 in 2020 to 2021, 0.83 in 2022 to 2023, and 0.86 in 2024 to 2026. What weakened is the small one-week lead, from 0.22 in 2020 to 2021 to 0.03 in 2024 to 2026.
Which altcoins are least correlated with Bitcoin?
The exchange tokens: LEO at 0.17 and WBT at 0.33 on weekly returns. Among the other large coins, Hyperliquid (0.49, only 70 weeks), Ripple (0.53), Dogecoin (0.53), and Tron (0.54) were the loosest. Ethereum was the closest at 0.79.
Which altcoins have the highest beta to Bitcoin?
Sui at 1.54 (184 weeks of data), Near at 1.35, Avalanche at 1.28, Solana at 1.22, and Cardano at 1.20. Monero (0.88) and Ripple (0.91) moved less than Bitcoin. The basket’s beta was 1.04.
Can you trade altcoins on yesterday’s Bitcoin move?
Not by following it. Going long alts after a BTC up day and short after a down day turned $1,000 into $0.27 from 2017 to 2026 (1x, 4 bps per side). The reverse pattern, a bounce after Bitcoin’s worst fifth of days, made $45,911 on paper, but it came mostly from 2017 to 2021, had a t-stat of 1.2 from 2022 on, and depends on a basket of today’s survivors.
Do altcoins move together with Bitcoin in sell-offs?
More than in rallies. The basket’s weekly correlation with BTC was 0.77 in weeks Bitcoin fell and 0.55 in weeks it rose. The alt basket averaged +7.3% in BTC up weeks and -6.8% in BTC down weeks.
Can you trade altcoins using Bitcoin’s SuperTrend?
Not in this test. Reversing a 2x position on each alt at every BTC hourly SuperTrend flip (ATR 10, multiplier 3.0, 4 bps per side) turned $1,000 into under $50 for 17 of 18 alts, and six went bust. Bitcoin itself ended at $127. Funding, spread, and slippage were not even included.
Does the test include stablecoins or wrapped coins?
No. I excluded Bitcoin, stablecoins, tokenized gold and treasuries, and wrapped or staked BTC and ETH, and took the next 20 coins on the CoinGecko ranking of 17 November 2026. Rain and CC (Canton) were skipped because they have no daily price history.
What data did this bitcoin altcoin correlation test use?
Daily USD closes from Yahoo Finance (Bybit for Hyperliquid, Uniswap, and Sui) for the correlations, and Binance hourly candles for the SuperTrend tests and an independent re-check. The coin universe is today’s top 20, so survivorship bias applies. The last daily point can be a partial day.