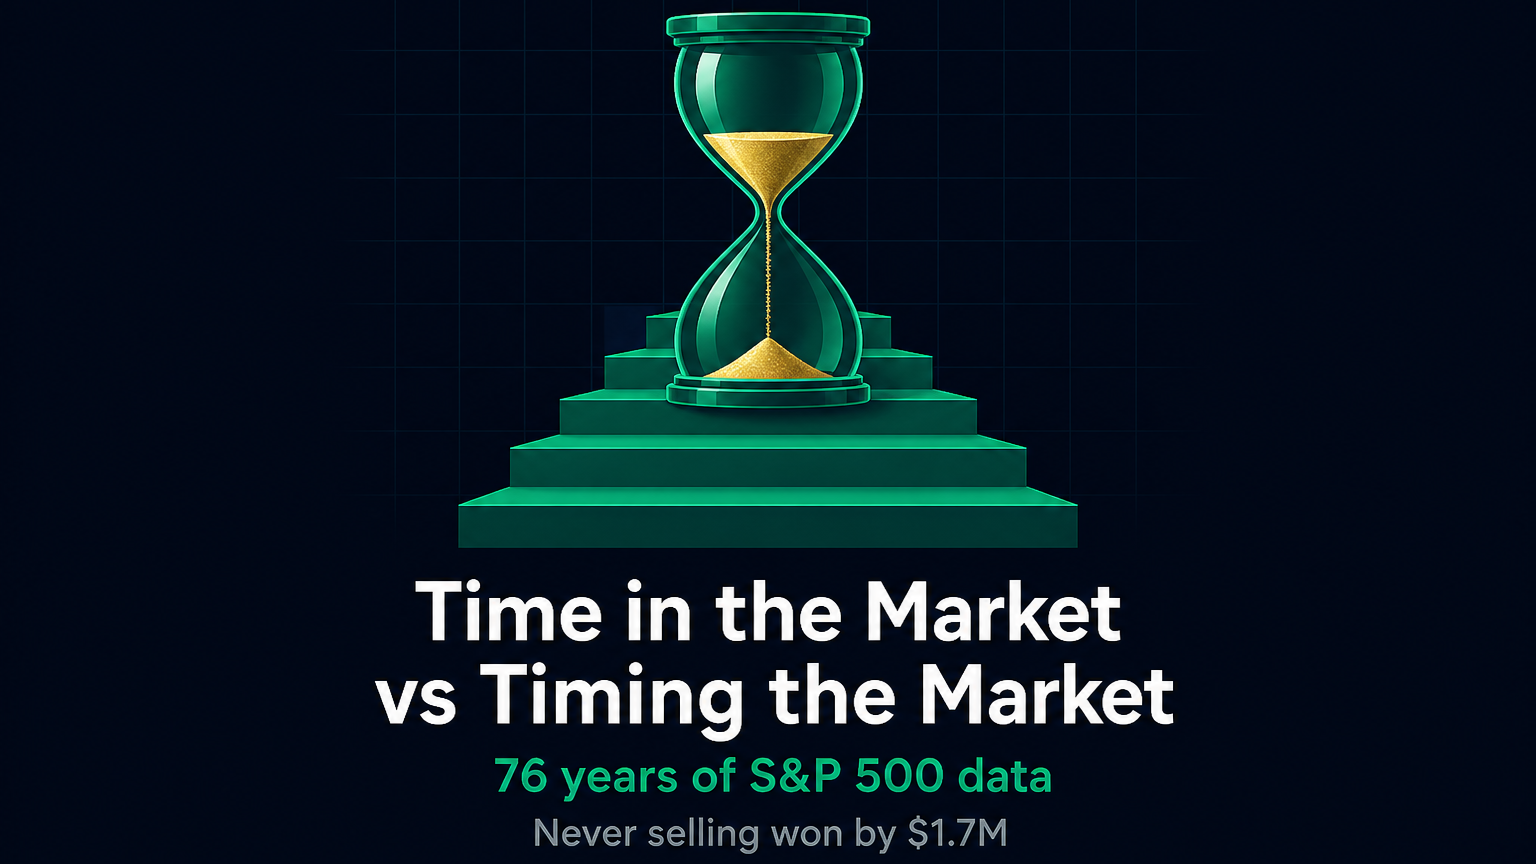
Put $10,000 in the S&P 500 in January 1950 and never touch it, and you end up with $4,585,744 today. Run the best timing rule I could code on the same prices, and you end up with $2,887,769. That gap, about $1.7 million, is the whole time in the market vs timing the market debate in one number. Sitting still won. It was not close.
I tested this because the usual version of the argument is a slogan, and slogans do not tell you what to do on a Monday. So I downloaded every daily close of the S&P 500 since 1950, coded the timing rules people actually use, and let them run. Then I asked the harder follow-up question: if you know you will need the money on a particular date, how many years do you need before selling stops being a gamble?
Never sold
$4.59M
$10,000 from Jan 1950, 8.32% a year
Best timing rule
$2.89M
200-day average, 7.67% a year
Missed the 10 best days
$1.99M
10 days out of 19,289
Safe selling point
15 years
No losing window in this sample
Time in the market vs timing the market, side by side
Here is the whole test in one table. Same prices, same start date, same $10,000. The only difference is when each rule was holding stocks and when it was sitting in cash.
| What you did | $10,000 became | Growth per year | Worst drop | Time in cash | Best 10 days missed | Trades |
|---|---|---|---|---|---|---|
| Never sold | $4,585,744 | 8.32% | −56.8% | 0% | 0 | 0 |
| 200-day average, cash pays 0% | $2,887,769 | 7.67% | −28.3% | 28.1% | 10 | 448 |
| 200-day average, cash pays 3% | $5,459,766 | 8.57% | −22.6% | 28.1% | 10 | 448 |
| Sell at −20%, rebuy at +20%, cash 0% | $2,632,634 | 7.54% | −51.0% | 8.8% | 9 | 26 |
| Sell at −20%, rebuy at +20%, cash 3% | $3,210,955 | 7.82% | −49.7% | 8.8% | 9 | 26 |
| Random cash, same time out as the average | $2,145,031 | 7.25% | −57.8% | 28.4% | 4 | 7,885 |
| Perfect hindsight: skip every bear market | $78,632,076 | 12.41% | −19.9% | 19.9% | 9 | 26 |
Read the top two rows and you have your answer. Every rule that had to make its decisions in real time finished behind doing nothing. The one exception is the second row of the moving average, where I paid the idle cash 3% interest. That version wins, and it is worth being honest about why: it wins because the money earned a coupon while parked, not because the exits dodged anything. Take the coupon away and the same trades lose $1.7 million. Add the tax you would owe on 448 round trips and the coupon itself, and the edge is gone.
The last row is the fantasy version. Sell at the exact top of every bear market, buy back at the exact bottom, and $10,000 becomes $78 million. Nobody does that. I include it because it sets the ceiling: perfect foresight is worth about 4 percentage points a year, and everything short of perfect gives most of that back.
Growth per year
The steady annual rate that would get you from the start value to the end value. 8.32% a year for 76 years is what multiplies $10,000 by 459.
Worst drop
The deepest fall from a previous high before a new high arrived. Minus 56.8% is the 2007 to 2009 slide. This is the number that makes people sell.
The unlucky one in ten
When I run 2,500 random start dates, this is the result that only 10% of them did worse than. It is the bad-but-not-crazy case, not the disaster case.
What I ran, and why the file starts in 1950
The data is every daily close of the S&P 500 from Yahoo Finance, 3 January 1950 to 2 September 2026. That is 19,289 trading days and 76.7 years. The index went from 16.66 to 7,639.85.
I could have started in 1927, and my first pass did. I threw that out. The 1929 crash and the Depression distort every conclusion, and they do it in a direction that flatters timing rules: when the market falls 86%, any rule that goes to cash looks brilliant. Nobody investing today lived through it as an investor. 1950 is the earliest start where the sample is a market that people alive now have actually traded. It also means my numbers are more honest about timing, not less, because I removed the one episode that timing rules feed on.
Three caveats you should hold onto for the rest of this article. This is the price index, so no dividends. Adding them would lift every buy-and-hold number and hurt timing further, since cash does not collect dividends. There is no inflation adjustment, so 8.32% a year is not what your buying power did. And there are no costs or taxes, which again flatters the rules that trade 448 times.
The rules themselves are simple on purpose. The 200-day average: hold stocks when yesterday’s close was above the average of the last 200 closes, otherwise sit in cash. The minus 20% rule: sell once the index is 20% below its high, buy back once it has risen 20% off the low. The random control sits in cash just as often as the moving average does, but on randomly chosen days. That control matters, and I will come back to it.
If you want the companion question of how to get invested in the first place, lump sum against spreading it out, I covered that in long-term S&P 500 investing. This article is about what happens after you are in.
Missing the best days
This is the chart everyone shares, and for once the popular version is right. The market’s gains are not spread evenly across the years. They are concentrated in a handful of days, and if you are in cash on those days you do not get a second chance.
Out of 19,289 trading days, the 10 best ones carry 57% of the final outcome. Miss just those 10 and $4.59 million turns into $1.99 million. Miss 60 days, which is three tenths of one percent of the sample, and you keep $202,235 out of $4.59 million. You gave up 95.6% of the result by being absent for 0.3% of the time.
| Days you were in cash | $10,000 became | Growth per year | Share of the result given up |
|---|---|---|---|
| None, invested all along | $4,585,744 | 8.32% | 0% |
| The 10 best days | $1,990,680 | 7.15% | 57% |
| The 20 best days | $1,138,259 | 6.37% | 75% |
| The 30 best days | $703,135 | 5.70% | 85% |
| The 40 best days | $450,371 | 5.09% | 90% |
| The 50 best days | $298,543 | 4.53% | 93% |
| The 60 best days | $202,235 | 4.00% | 96% |
Notice how gentle the yearly numbers look while the dollar column collapses. Missing 60 days drops you from 8.32% a year to 4.00% a year. That sounds survivable. Over 76 years it is the difference between $4.6 million and $202,000. Compounding is unforgiving about small, permanent losses.
Why you cannot skip the bad days and keep the good ones
The obvious objection is that nobody is trying to miss the best days. People are trying to miss the worst ones. The problem is that the two live in the same neighbourhood.
Of the 10 best days since 1950, nine happened during an official bear market. Seven of them happened within 20 trading days of the exact bottom. Widen it to the 20 best days and 18 of them are inside a bear market, 19 within 40 days of a low. Meanwhile bear markets only account for 19.9% of all trading days. One fifth of the calendar holds almost all of the fireworks.
| Rank | Date | Gain that day | During a bear market? | Within 20 days of the bottom? |
|---|---|---|---|---|
| 1 | 13 Oct 2008 | +11.58% | Yes | No |
| 2 | 28 Oct 2008 | +10.79% | Yes | Yes |
| 3 | 9 Apr 2025 | +9.52% | No | No |
| 4 | 24 Mar 2020 | +9.38% | Yes | Yes |
| 5 | 13 Mar 2020 | +9.29% | Yes | Yes |
| 6 | 21 Oct 1987 | +9.10% | Yes | No |
| 7 | 23 Mar 2009 | +7.08% | Yes | Yes |
| 8 | 6 Apr 2020 | +7.03% | Yes | Yes |
| 9 | 13 Nov 2008 | +6.92% | Yes | Yes |
| 10 | 24 Nov 2008 | +6.47% | Yes | Yes |
Look at the dates. Four of the top ten are inside eight weeks of autumn 2008. Four more are March and April 2020. These are exactly the moments when a timing rule has you sitting in cash, because that is what the rule is for. The 200-day average missed all ten of them. The minus 20% rule missed nine.
2020 is the cleanest example of the trap. The index peaked on 19 February and hit bottom 23 trading days later. It was back at a new high inside six months. Any rule slow enough to confirm a downtrend sold near the low and bought back higher. That is not bad luck, it is arithmetic: a rule that waits for confirmation cannot react to a crash that is over in a month.
What timing actually buys you
I want to be fair to the moving average, because the popular version of this argument is unfair to it. The rule is not noise. Compare it with my random control, which sits in cash exactly as often but on random days: random cash ended at $2.15 million with a worst drop of 57.8%, while the moving average ended at $2.89 million with a worst drop of 28.3%. Same amount of time out of the market, hugely different risk. The moving average is genuinely picking better months to be scared.
That is the real product here. Not more money, less pain. Across random windows, the median worst drop for someone sitting still was minus 33.9% over ten years. For the moving average it was minus 16.5%. Half the hole, consistently.
But it never turned into more money often enough to matter. Here is how often each rule actually beat doing nothing, across 2,500 random start dates per holding period.
| If you held for | Never sold, growth per year | 200-day average, growth per year | Average beat sitting still | −20% rule beat sitting still | Worst drop, never sold | Worst drop, average |
|---|---|---|---|---|---|---|
| 1 year | 10.29% | 6.65% | 31% | 44% | −10.6% | −7.5% |
| 3 years | 8.97% | 6.99% | 38% | 34% | −19.9% | −11.4% |
| 5 years | 8.54% | 6.99% | 46% | 29% | −28.0% | −13.5% |
| 10 years | 8.31% | 6.67% | 42% | 33% | −33.9% | −16.5% |
| 15 years | 6.97% | 6.68% | 50% | 41% | −48.2% | −17.9% |
| 20 years | 6.82% | 6.48% | 44% | 31% | −48.2% | −17.9% |
| 30 years | 7.77% | 7.16% | 44% | 12% | −49.1% | −28.3% |
All figures are medians across the trials. The moving average never wins more than half the time, and its typical yearly growth is below sitting still at every single horizon. That is a remarkably consistent loss for a rule that many people treat as free insurance.
Where the moving average did work
It worked in the 1950s to the 1970s, and it has been losing ever since. Split the file into periods and the pattern is not subtle.
| Period | Never sold | 200-day average | −20% rule | Worst drop, never sold | Worst drop, average |
|---|---|---|---|---|---|
| 1950 to 1980 | 6.36% | 7.33% | 5.60% | −48.2% | −14.2% |
| 1980 to 2000 | 14.00% | 12.16% | 12.43% | −33.5% | −17.9% |
| 1990 to 2026 | 8.69% | 6.58% | 8.50% | −56.8% | −28.3% |
| 2000 to 2026 | 6.42% | 4.80% | 6.16% | −56.8% | −24.9% |
| 2010 to 2026 | 12.14% | 7.19% | 10.54% | −33.9% | −19.7% |
The 1950s through the 1970s gave the rule what it needs: slow, grinding declines that lasted a year or more, so there was time to get out and time to get back in. The market since 2010 gives it the opposite: sharp drops, fast recoveries, and long stretches where the index just grinds up and any time in cash is pure cost. Since 2010 the average cost five percentage points a year.
When I would use a 200-day rule
On a slice of the portfolio I have decided in advance should be smaller during long declines, and only when I can genuinely leave money in cash without feeling I have to redeploy it. Think 1973 or 2000 to 2002: months of deterioration, not a three-week panic. Expect to pay for the calm.
When I would not
On the main pot, on a 10-year-plus horizon, or as a way to make more money. You will not execute 448 disciplined switches, and the crash you are most afraid of is probably the V-shaped kind, which is the one this rule handles worst.
If you know you will need the money
Here is where “stay invested forever” stops being useful advice. Most people have a date: a house, a tuition bill, a retirement. So I ran a different test. Pick a random day, buy, then sell on a fixed anniversary no matter what the market is doing. No waiting for a bounce. 2,500 random start dates for each holding period.
| Sell after | Chance of a loss | Typical result | Unlucky one in ten | Unlucky one in twenty | Worst case | Beat 3% in cash | Saw a 50% drop on the way |
|---|---|---|---|---|---|---|---|
| 1 year | 25.6% | +10.9% | −12.4% | −17.5% | −47.7% | 69% | 0.4% |
| 3 years | 14.0% | +28.0% | −7.8% | −21.9% | −43.3% | 78% | 3.4% |
| 5 years | 16.6% | +51.4% | −7.7% | −14.0% | −37.3% | 75% | 6.4% |
| 7 years | 7.8% | +73.7% | +3.7% | −4.3% | −35.1% | 77% | 9.0% |
| 10 years | 7.4% | +120.6% | +5.7% | −4.4% | −44.5% | 80% | 14.0% |
| 15 years | 0% | +186.7% | +46.3% | +38.6% | +5.8% | 83% | 23.6% |
| 20 years | 0% | +275.0% | +110.2% | +95.3% | +55.3% | 98% | 32.0% |
| 25 years | 0% | +451.9% | +241.4% | +194.6% | +110.3% | 100% | 34.5% |
Three things jump out. A one-year holding period loses money one time in four. Five years is barely better than three, because five years is long enough to walk into a crash and too short to wait it out. Seven years is the first point where even the unlucky one in ten finishes ahead. And fifteen years is the first holding period with no losing outcome anywhere in the 2,500 trials, with the worst case at plus 5.8%.
The last column is the honest cost of that safety. The longer you stay, the more likely you are to live through a 50% fall at some point. At one year the chance is under 1%. At twenty-five years it is about one in three. Staying invested does not mean avoiding the crash. It means the crash becomes a chapter instead of the ending.
You are down after the first year. Now what?
About 27% of random start dates are underwater on the first anniversary. If you sell that day, the typical loss is 9.6%. So I kept only those unlucky starts and asked what happens if you refuse to sell.
| Hold instead until | Back in profit | Typical result | Unlucky one in ten | Worse than just selling |
|---|---|---|---|---|
| Year 2 | 58% | +3.0% | −27.1% | 25% |
| Year 3 | 74% | +12.3% | −18.6% | 14% |
| Year 5 | 72% | +23.1% | −15.9% | 12% |
| Year 10 | 85% | +60.1% | −4.3% | 5% |
| Year 15 | 100% | +117.9% | +43.7% | 0% |
Waiting to year three already turns three quarters of those bad starts into a profit. By year fifteen, every one of them recovered, and not a single path ended worse than taking the loss in year one. A red first year is a normal event, not a signal. The mistake I keep seeing is letting that first year rewrite the plan, which is the index version of a habit I wrote about in refusing to sell a single stock until break even.
You bought the exact top
The nightmare scenario. I took each official market peak since 1950, bought there, and sold on a fixed anniversary.
| You bought this peak | Fall that followed | Back to break even | Sold after 5y | Sold after 10y | Sold after 15y |
|---|---|---|---|---|---|
| Nov 1968 | −36.1% | 3.3 years | −13.6% | −13.5% | +54.0% |
| Jan 1973 | −48.2% | 7.5 years | −24.6% | +15.1% | +104.2% |
| Mar 2000 | −36.8% | 7.2 years | −23.2% | −22.3% | +35.9% |
| Oct 2007 | −51.9% | 5.5 years | −7.0% | +63.3% | +134.5% |
| Feb 2020 | −33.9% | 0.5 years | +76.7% | n/a | n/a |
Buying the worst possible day in 2000 left you down 22% ten years later. Fifteen years in, you were up 36%. That is the worst case in the post-1950 record: a lost decade, not a lost life. Every peak since 1950 was repaired within about seven and a half years, and every one of them was comfortably profitable by year fifteen. That is the same fifteen-year number arriving from a completely different direction, which is the main reason I trust it.
What I would actually do with this
Treat staying invested as the default, and put the effort into being able to stay. Invest the money when it arrives. Size the position so that a 50% fall is survivable rather than something that forces you to sell at the bottom. That is the whole plan, and the data says it beats every rule I could code.
If you have a date, write it down before you buy. Anything under seven years should be treated as a gamble on timing you cannot control, and money you need in three years probably does not belong in the index at all. Between seven and fifteen years, expect it to work and accept that it might not. Past fifteen, the historical record stops producing losses.
If you truly cannot sleep through a bear market, a 200-day rule on part of the portfolio is a defensible choice. Just price it correctly: you are buying a smaller drawdown, and paying somewhere around half a percentage point to five percentage points a year for it depending on the era. Do not confuse it with a way to make more money, and do not confuse it with a strategy that is trying to beat the index, which is a separate job I looked at in the momentum write-up. If you want the macro context of whether a decline looks like a slow grind or a snap-back, that is what the leading indicators blend is for.
Conclusion
Time in the market vs timing the market has a clear winner in 76 years of S&P 500 prices, and it is time in the market. Never selling turned $10,000 into $4.59 million. The best real-time rule managed $2.89 million and had to be in cash for the ten biggest up days to do it. No rule beat doing nothing in more than half of random windows, at any horizon.
What timing did deliver was a calmer ride: roughly half the drawdown, at a price measured in hundreds of thousands of dollars over a lifetime. That is a legitimate trade if you know you are making it. Most people who quote the timing argument think they are buying returns, and they are actually buying comfort at a steep markup.
The number I would keep from all of this is not the $4.59 million. It is fifteen years. That is the point where every random buy date in this sample finished ahead, where every unlucky start recovered, and where even buying the exact top of 1973 or 2000 turned into a solid gain. If your money has fifteen years, the market has never needed you to be clever. If it does not, no timing rule fixes that, and you should be asking whether the money belongs in stocks at all.
FAQ: time in the market vs timing the market
Is time in the market better than timing the market?
In 76 years of S&P 500 prices, yes. Staying invested turned $10,000 into $4.59 million since January 1950. The best timing rule I tested, a 200-day moving average, produced $2.89 million. Selling at minus 20% and buying back at plus 20% produced $2.63 million. Neither beat staying invested in more than half of random windows at any holding period.
What happens if you miss the 10 best days in the market?
Your $4.59 million becomes $1.99 million. Those 10 days out of 19,289 carry 57% of the total outcome. Miss the 60 best days, which is 0.3% of all trading days, and you keep $202,235 instead of $4.59 million. Yearly growth falls from 8.32% to 4.00%, which sounds small and costs almost everything.
Why can’t I just avoid the worst days instead?
Because the best and worst days sit in the same weeks. Nine of the 10 best days since 1950 happened during an official bear market, and seven of them within 20 trading days of the exact bottom. Four of the top ten are in autumn 2008 and four are in spring 2020. A rule that gets you out of the falls also has you in cash for the rebounds.
Does a 200-day moving average beat buy and hold?
Not on money. It produced 7.67% a year against 8.32% for sitting still, and it lost in every sub-period since 1980. Since 2010 it cost about five percentage points a year. What it did do is cut the worst drop from minus 56.8% to minus 28.3%. It also missed all 10 of the best days and required 448 switches.
How much does trying to time the market cost?
On a $10,000 stake held since 1950, the 200-day moving average cost $1,699,529. That is 0.65 percentage points a year, and it left you with 63% of the wealth you would have had by doing nothing. The gap is not steady: the rule was ahead until the late 1990s and has cost about five percentage points a year since 2010.
Should I sell my stocks before a recession?
The mechanical version of that instinct is the minus 20% rule, and it finished $1.95 million behind sitting still while still suffering a 51% drop, so it barely reduced the pain it was bought for. The problem is that you have to be right twice, on the way out and on the way back in. In 2020 the entire fall lasted 23 trading sessions and the index was at a new high within six months.
How long should I stay invested before I sell?
If the sale date is fixed, seven years is the first holding period where even the unlucky one in ten finishes in profit. Fifteen years is the first with no losing outcome in 2,500 random trials, worst case plus 5.8%. Under five years the chance of selling at a loss is 14% to 26%, so treat short horizons as a gamble rather than an investment.
Should I sell after a bad first year?
Historically no. About 27% of start dates are down after 12 months, with a typical loss of 9.6%. Holding those same starts to year three put 74% back in profit, and by year fifteen all of them recovered with none finishing worse than selling in year one. A losing first year is a normal event, not information.
Is now a good time to invest in the S&P 500?
This data cannot tell you what happens next, but it does say the entry date matters far less than people think. Across random buy dates since 1950, 74% of one-year holds and 93% of ten-year holds finished in profit, and every fifteen-year hold did. Even buying the exact worst day available, March 2000, was up 36% by year fifteen. The question that actually decides the outcome is not whether today is a good day, it is when you will need the money back.
Should I wait for a crash before investing?
Waiting has a price and the crash keeps its own schedule. Since 1950 a bear market has arrived roughly once every 5.9 years, so the wait can be long, and cash misses the biggest up days, nine of which happened inside a bear market. Buying the exact top of every bear market since 1950 still got back to break even in a median of 2.0 years, and every one of those worst-possible purchases was profitable by year fifteen.
How long does it take the S&P 500 to recover from a crash?
There have been 13 official bear markets since 1950, with a typical fall of 32%. The median time back to the old high was 2.0 years and the average was 2.9. Nine of the 13 recovered within three years. The slowest was January 1973, which took 7.5 years. The fastest was February 2020, back to a record in six months.
What is the average annual return of the S&P 500 since 1950?
8.32% a year on the price index, which turned $10,000 into $4,585,744 over 76 years. With dividends reinvested the figure would be several points higher. The ride was uneven: the best ten-year stretch returned 15.87% a year and ended in 1998, the worst returned minus 3.02% a year and ended in 2008. Only 6 of 67 ten-year windows finished negative.
Why does this study start in 1950 and not earlier?
Because almost nobody investing today was an investor before 1950, and the 1929 crash distorts the comparison in favour of timing: when a market falls 86%, any rule that moves to cash looks brilliant. Starting in 1950 removes the single episode timing rules depend on, so it is a tougher test for buy-and-hold, not an easier one.
Does this include dividends?
No. This is the S&P 500 price index. Dividends historically added roughly 1.5 to 4 percentage points a year depending on the decade, and they would only improve the staying-invested results, because cash does not collect dividends. There is also no inflation adjustment, no trading costs and no taxes in these numbers.