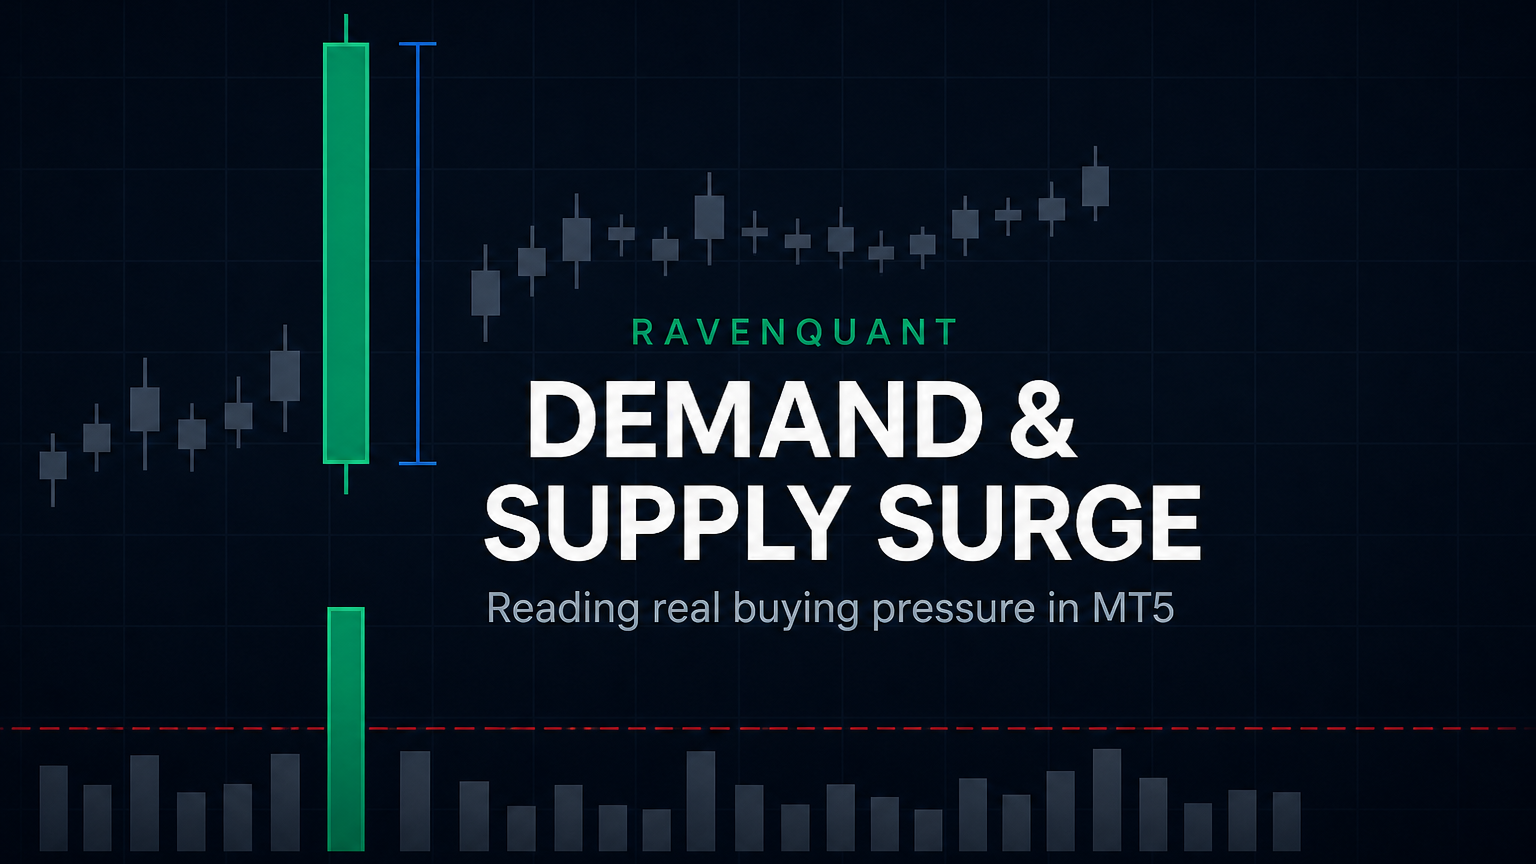
Price does not move because a pattern completed. It moves because somebody decided that owning an instrument right now was worth more than waiting for a better price, and there were not enough willing sellers at that level to satisfy them. A demand and supply surge is what that decision leaves behind on the chart: one bar where a side stopped being patient and paid whatever it cost to get filled.
Strip away the jargon and the idea is almost boring. A demand surge means aggressive buyers consumed the resting offers faster than sellers replaced them, so price had to travel upward to find liquidity. A supply surge is the same thing upside down. Everything you actually see, the wide range, the dominant body, the close pinned near the extreme, the burst of volume, is a consequence of that single fact.
This article is meant to be read in order. It starts with the mechanism, then covers why surges happen at all, then how to interpret one when it appears on your screen. Only after that does it get practical: how MetaTrader 5 forces an approximation instead of a measurement, and how to switch the detector on in the RavenQuant Combo Dashboard and read it live. I will also be blunt about what a surge does not do, because in my own testing a volume burst on its own is not a directional edge.
Default thresholds in RQ Combo v3.32
Minimum bar range versus the 20-period ATR
Close must sit in the top (or bottom) quarter of the range
Tick volume versus the average of the previous 20 bars
Bars of history needed to classify a single surge candle
What a demand and supply surge actually is
Every market contains two kinds of participant at any moment, and the difference between them explains most of how price behaves.
Passive participants post limit orders and wait. They supply liquidity: an offer to sell at 1.2510, a bid to buy at 1.2508. Stacked across dozens of price levels, those resting orders form the order book, and they are what makes a market tradeable at all.
Aggressive participants cross the spread with market orders. They consume liquidity. They take what is already posted, at the price it is posted, because getting filled now matters to them more than getting filled well.
Price changes only when aggression exhausts the passive side. A market buy for five lots meeting three lots of resting offers fills three at that price and the other two one level higher. The quote has moved, and nothing mystical happened. Repeat that a few hundred times inside a single bar and you have a demand surge.
So the word “surge” is not really about size. A very large order worked patiently through a deep book barely moves anything, while a modest order into a thin book moves it a lot. What defines a surge is imbalance: a demand for immediacy on one side with nothing comparable standing on the other.
Demand surge (bullish)
Wide range compared with recent volatility. Bullish body taking most of that range. Close near the high, so sellers never pushed it back. Activity well above the recent norm. The bar looks like buyers refused to wait.
Supply surge (bearish)
Same geometry, flipped. Wide range, dominant bearish body, close near the low, elevated activity. Nobody defended the level intrabar. Rallies inside the bar were sold immediately.
Notice what is missing from both definitions: any claim about what happens next. A surge is a statement about the bar that just closed, not a forecast. That distinction matters more than most indicator marketing admits, and the rest of this article keeps coming back to it.
Stop hunting for these bars by eye
Scrolling back through months of candles looking for wide bars with heavy volume is exactly the kind of job worth handing to software. The RavenQuant Combo Dashboard marks every demand and supply surge automatically on closed bars, with thresholds you can see and change, and prints a cumulative trend direction and power score right above them so the bar is never read without its context.
See the RavenQuant Combo DashboardMetaTrader 5, any symbol, any timeframe. Eighteen detectors in one dockable panel.
Why a demand and supply surge happens
Understanding the mechanism is one thing. Knowing what puts a market into that state is what lets you judge whether a marker on your chart deserves attention. In practice there are five recurring causes, and they are not equally interesting.
| Cause | What is happening underneath | Typical aftermath |
|---|---|---|
| New information | A data release, headline, or earnings figure forces everyone to reprice at the same instant | Violent, then unstable |
| Execution urgency | A fund, corporate, or hedger must finish an order today and accepts worse prices to do it | Often continues |
| Stops and forced exits | A level breaks, protective stops convert into market orders, and that aggression triggers more stops | Fast, then fades |
| Thin liquidity | Session handover, rollover, or a holiday leaves the book empty, so ordinary size travels much further | Frequently retraced |
| Positioning unwind | A crowded trade turns and everyone tries to leave through the same door at once | Extended and messy |
Two families, and why the difference matters
Those causes collapse into two families, and this is the single most useful idea in the whole article.
In the first family, somebody genuinely wants in or out. Real interest arrived and had to be satisfied. Execution urgency and positioning unwinds belong here. The order that caused the bar is usually not finished, because large intentions rarely complete inside one candle, so this kind of surge tends to have something behind it.
In the second family, nobody was there. The book was thin, or protective stops fired mechanically into an empty market. No new opinion about value was formed and nothing was accumulated. Price moved because there was no resistance to it moving, and once liquidity comes back the level usually gets reclaimed.
News sits awkwardly across both, which is why I treat it separately later on. The first seconds after a release are pure vacuum: market makers pull their quotes, the book empties, and price gaps through levels that nobody is defending. Real repricing follows, but it arrives after the spike, on a spread that has widened and with fills nothing like the ones you would get in a normal session.
That is why I keep describing the detector as a filter. It reliably answers “was this bar unusual”. It cannot answer “was this bar meaningful”. The second question is answered by where the surge occurred and by what followed, which is the subject of the next section.
How to read a demand and supply surge
A marker is the start of the analysis. Three questions, asked in this order, cover almost everything I do with one.
1. Where did it happen?
Location does more work than the bar itself. A demand surge in the middle of a range is noise with good posture. The same bar breaking a level the market defended three times before is a statement, because the people who were defending that level just stopped. Before reading anything into a surge, look at what it happened through: a prior swing high or low, the edge of a consolidation, a session high, an untested gap.
2. What did the following bars do?
This is the test that separates the two families above, and it costs you nothing but patience. Genuine interest keeps showing up. If the surge came from real demand, the bars after it should hold most of the ground and any pullback should be shallow and slow. If the surge came from an empty book, price tends to come straight back through the candle within a handful of bars.
3. Which of the three outcomes is this?
Continuation
The surge breaks structure and price holds above (or below) it. The sellers who were defending the level are done. This is the most straightforward reading and the least common.
Pullback into the candle
Aggressive moves leave inefficiency behind. Price often returns into the body of the surge bar before continuing, which gives a slower entry with a tighter invalidation than chasing the close.
Failure
The surge is fully retraced within a few bars. Aggressive buyers were met by size and lost. That is information too, and it changes my bias faster than most reversal patterns.
The failed surge is the most useful of the three and the least discussed. When aggression shows up and gets absorbed without the market going anywhere, you have learned that someone larger is on the other side. I do not fade surges mechanically, but a failure at an important level tells me more than a successful one in the middle of nowhere.
Why MT5 cannot measure real order flow
Everything above describes the order book. The obvious next question is whether you can simply watch it. On a centralised venue with a consolidated tape, equity futures for example, you largely can: footprint charts show traded volume at each price split by aggressor side, and delta gives you the net. You literally count who paid up.
Retail FX and CFD trading does not work that way. It runs over the counter. There is no single exchange, no consolidated tape, and no obligation for your broker to publish anything beyond its own quote stream. Three consequences follow, and they shape every volume tool you will ever run in MetaTrader.
First, the volume figure on your chart is usually tick volume, which counts price updates, not contracts or lots. A quiet hour with a twitchy feed can print more ticks than a busy hour on a stable feed. Tick volume correlates reasonably well with real activity in liquid FX pairs, but it is a proxy, and it belongs to your broker rather than to the market.
Second, there is no reliable aggressor tag. The MT5 tick structure does have buy and sell flags, but plenty of FX brokers never populate them. Without that flag you cannot separate a trade that lifted the offer from one that hit the bid, which is the entire basis of delta.
Third, there is no depth history. Even where a broker exposes market depth live, it is that broker’s book, and it is not stored for backtesting. Any historical “order flow” study on a retail MT5 feed is reconstructed from OHLC and tick counts.
| What true order flow gives you | What MT5 retail actually gives you | Usable proxy |
|---|---|---|
| Contracts traded at each price | Tick count per bar | Relative volume (RVOL) |
| Aggressor side (buy vs sell) | Usually missing or unreliable | Close location within range |
| Delta and cumulative delta | Not available | OBV built from tick volume |
| Resting liquidity in the book | Broker depth only, not stored | Prior swing highs and lows |
| Absorption at a level | Not observable | Wide range with weak follow-through |
I would rather say that plainly than sell you a red and green delta panel that is quietly guessing. The demand and supply surge detector is honest about being a structural proxy, and it uses only inputs that exist on every MT5 symbol.
The four conditions RQ Combo checks
The detector runs on closed bars only. The live candle is never evaluated, so a marker never repaints once printed. For each bar it tests four conditions in sequence, and all of them must pass.
1. Displacement
The bar range (high minus low) must be at least 2.0 times the 20-period ATR. This filters out normal bars and keeps only genuine expansion relative to current volatility.
2. Body dominance
The body (open to close) must be at least 55% of the range. A wide bar with two long wicks is indecision, not a surge, so it fails here.
3. Close location
For demand, the close must land in the top 25% of the range and above the open. For supply, the bottom 25% and below the open. This is the closest thing to an aggressor proxy.
The fourth condition is the volume one, and it is what separates a surge from an ordinary wide bar. The detector takes the tick volume of the signal bar and divides it by the average of the previous 20 bars. That ratio, relative volume, must be at least 2.0.
The optional OBV step
There is a fifth switch called “Require OBV step”, enabled by default. On-Balance Volume adds the bar’s tick volume when the close is above the previous close and subtracts it when the close is below. The filter simply asks whether OBV moved in the direction of the surge.
In practice this reduces to a single question: did the bar close above (or below) the previous bar’s close, not just its own open? That catches the case where a large bullish body still finishes underneath yesterday’s close after a gap down. It is a light filter, heavily correlated with the close location test, so turning it off widens your signal count without changing much. I leave it on for cleaner charts and switch it off when I want more samples for research.
Turning the surge detector on in RQ Combo
The demand and supply surge detector lives in the DETECTION section of the dashboard, alongside inside bars, fair value gaps, order blocks and the rest. Three clicks and you are done.
Want to follow along on your own charts?
Everything from here on happens inside the RavenQuant Combo Dashboard for MetaTrader 5. Eighteen closed-bar detectors, volume profile, swing structure and the surge engine described in this article, plus a cumulative trend direction and power score built from five indicator feeds, all in one panel.
Get the RavenQuant Combo DashboardWorks on any MT5 symbol and timeframe. No repainting: every detector evaluates closed bars only.
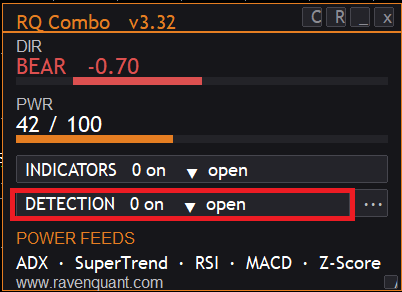
Click DETECTION to open the list. Every row is a separate detector with its own on and off state, so you can run the surge alone on a clean chart instead of drowning the price action in twenty overlapping labels.
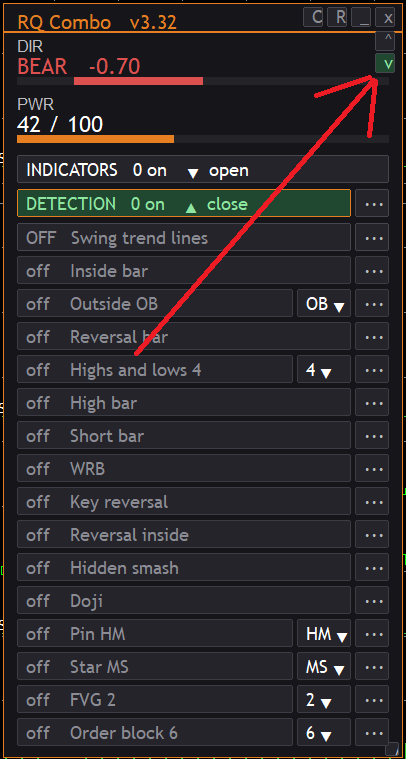
Scroll to the bottom of the list. Surge sits under MA cross, as the last entry before the POWER FEEDS footer. Left click the row to toggle it on. The number badge next to the row (2 in the screenshot) is the dropdown showing how many surge types are selected.
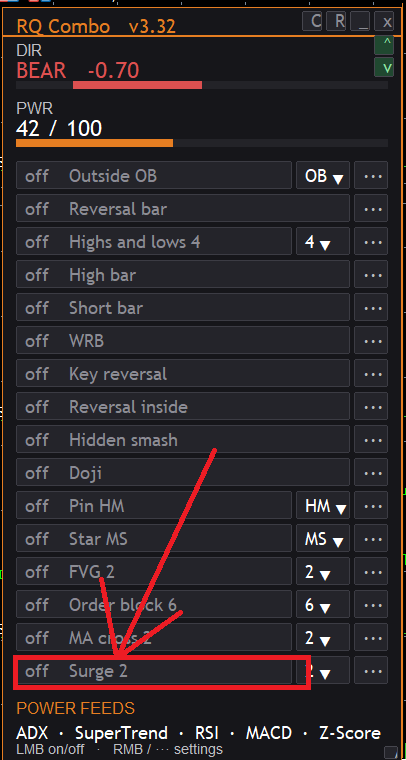
The dropdown holds two entries, “Demand surge” and “Supply surge”, and they are independent checkboxes. If you only trade longs in an uptrend, deselect supply and keep the chart quiet. The three dots on the right open the settings panel with the thresholds, the marker style, and the Wingdings symbol picker.
Markers follow the same convention as the rest of the dashboard. A demand surge prints a lime ↑DS below the candle, a supply surge prints a red ↓SS above it. Text labels are the default because arrows stack badly when several detectors fire on the same bar.
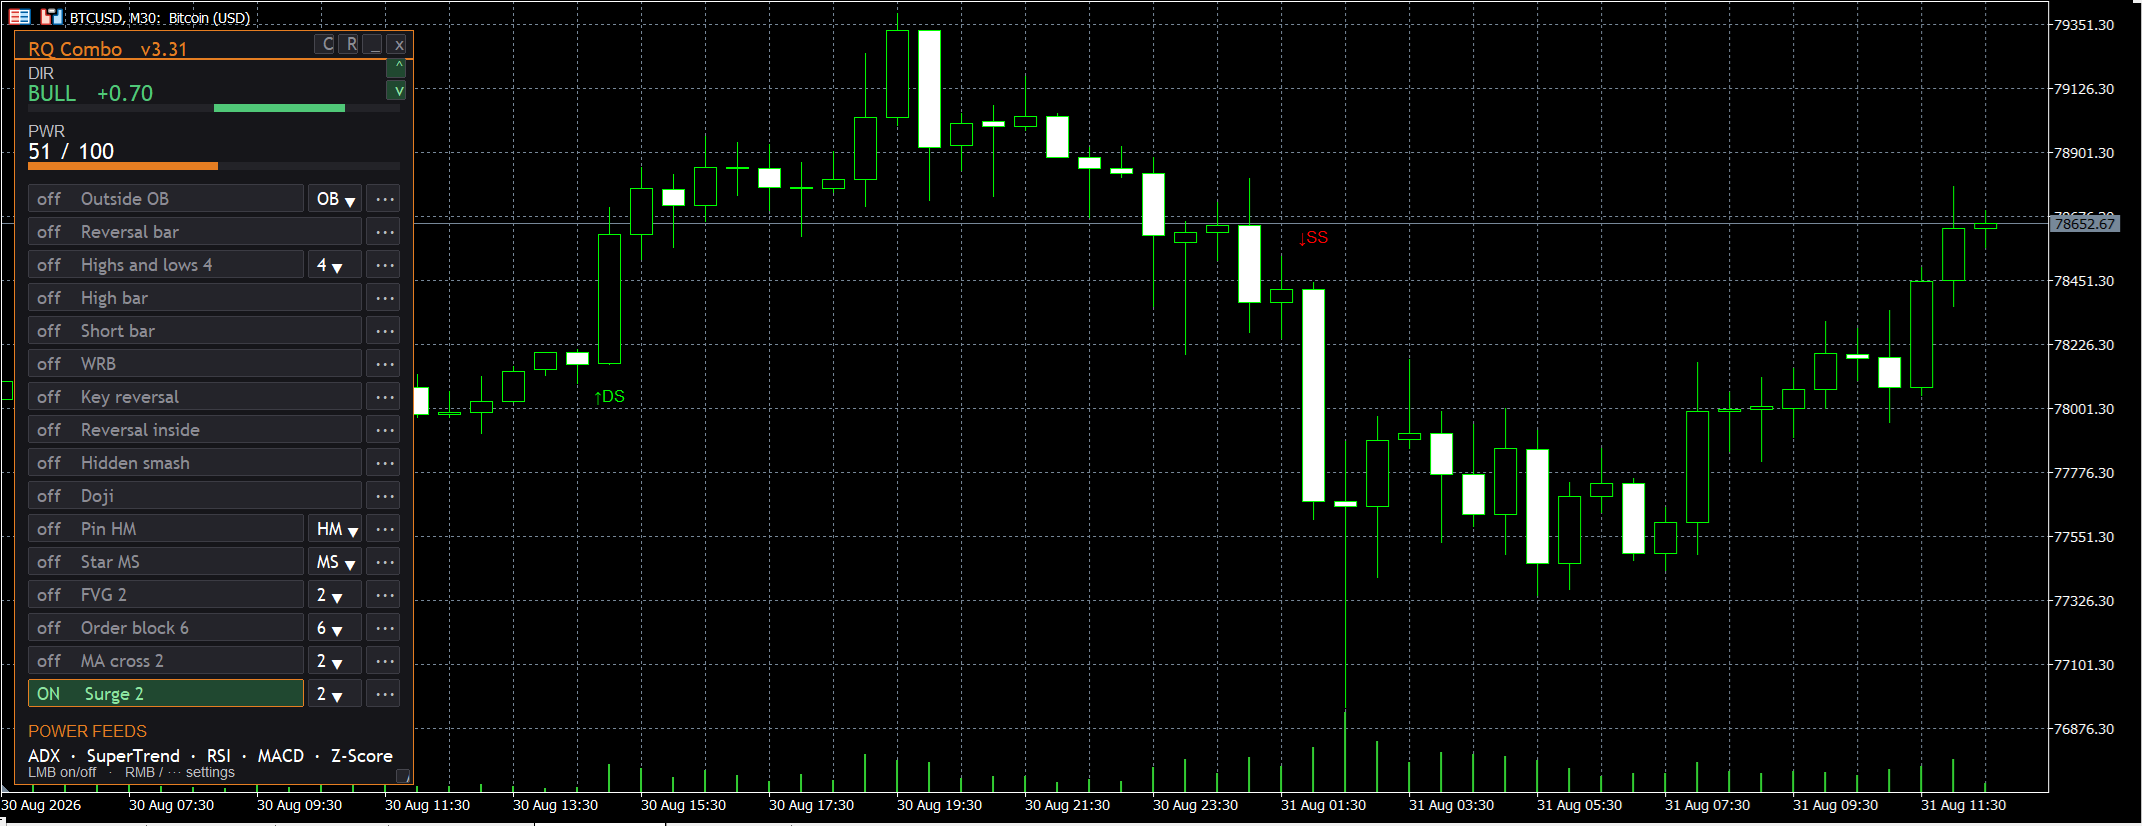
That screenshot is worth pausing on, because it shows the detector doing the job it is meant to do rather than the job people wish it did. Both markers landed on bars that turned out to matter, but neither was an entry on its own. The demand surge came mid-move, and the supply surge printed after price had already left the high. What they gave me was a shortlist of two bars to examine out of forty-odd on screen.
DIR and PWR: the cumulative reading above the detector list
Look at the top of the panel in either screenshot and you will see two rows that have nothing to do with the surge detector. They are the part of the dashboard I actually check first, and they answer the question a single-bar marker can never answer: which way is this market leaning right now, and how convincingly?
DIR is a cumulative trend direction. The dashboard reads five independent power feeds listed in the footer, ADX/DMI, SuperTrend, RSI, MACD and Z-Score, takes each one’s directional verdict, and averages them into a single number between −1.00 and +1.00. Above +0.15 it prints BULL, below −0.15 it prints BEAR, and anything in between reads FLAT because the feeds disagree. On the BTCUSD chart it shows BULL +0.70; on the AUDCAD chart, BEAR −0.66.
PWR is a cumulative strength score from 0 to 100, built the same way from the strength component of each feed. It then gets deliberately damped by how much the feeds agree: a reading with conflicted direction is scaled down, so you cannot get a confident-looking power number out of five indicators pulling against each other. That is why BTCUSD reads 51 rather than something inflated, and AUDCAD only 40.
Both values update on every closed bar and each feed can be excluded from the aggregate if you do not trust it on your instrument. They are also published as indicator buffers, so an Expert Advisor can read the dashboard’s direction and power directly with CopyBuffer instead of recomputing five indicators.
This pairing is the point of the whole panel. The surge answers this bar was unusual. DIR and PWR answer and here is the regime it happened in. A demand surge printing while DIR reads BEAR −0.66 is a very different piece of information from the same marker with DIR at BULL +0.70, and the dashboard puts both in your field of view without a second window.
Demand and supply surge settings that matter
The demand and supply surge defaults are deliberately strict. On a liquid pair at M15 you should see a handful of surges per week, not one per session. If you are drowning in markers, you loosened something too far.
| Setting | Default | Range | What it controls |
|---|---|---|---|
| Min range x ATR | 2.00 | 0.50 and up | How much bigger than normal the bar must be |
| Close zone frac | 0.75 | 0.55 to 0.95 | How close to the extreme the close must finish |
| Min body / range | 0.55 | 0.30 to 0.95 | How much of the bar is body rather than wick |
| RVOL lookback | 20 | 5 and up | Bars used for the volume baseline |
| Min RVOL | 2.00 | 1.00 and up | Volume multiple versus that baseline |
| Require OBV step | on | on / off | Close must also beat the previous close |
Two adjustments I make regularly. On M5 and M1, tick volume gets noisy and the ATR is small relative to spread, so I raise Min RVOL to 2.5 and Min range x ATR to 2.5. On H1 and H4 the opposite applies: bars are already large, surges are rarer, and dropping Min range x ATR to 1.7 gives a usable count without letting junk through.
The RVOL lookback interacts with your session. A 20-bar baseline on M15 covers five hours, so a London open surge is measured against the Asian session and will almost always clear the threshold. If you want session-aware behaviour, lengthen the baseline to roughly one full trading day of bars.
Combining the surge with the rest of the dashboard
The location question from earlier is much easier to answer when the chart marks the structure for you, and this is where running more than one detector pays off. Switch on Fair value gaps and Highs and lows alongside Surge, then act only where the labels agree. A demand surge that also breaks a structural high, or that leaves a fair value gap behind it in the same direction, is the continuation case with corroborating evidence. A surge floating in the middle of a range with nothing near it is the one to leave alone.
I work through the pullback reading the same way. Mark the surge bar, let price retrace into its body, and treat the failure of price to close back through that body as the trigger. The detector supplies the bar; the structure around it supplies the reason.
Honest limits: a surge is not an edge by itself
I test everything I publish, and I am not going to pretend this one came back with a clean result. I ran the detector logic across several years of AUDCAD data on M5 and M15, plus EURUSD samples, looking for directional payoff after each signal. The finding was consistent and unglamorous: activity spikes mark participation, not direction. Median forward returns after a surge clustered around the cost of trading rather than above it.
The cost side matters more than most people model. On my account a round trip on that pair costs roughly 1.15 pips including commission. On M15 that is about 0.20 ATR. On M5 it is closer to 0.36 ATR. A signal has to be genuinely predictive to clear a third of an average bar in transaction costs, and a volume burst on its own is not.
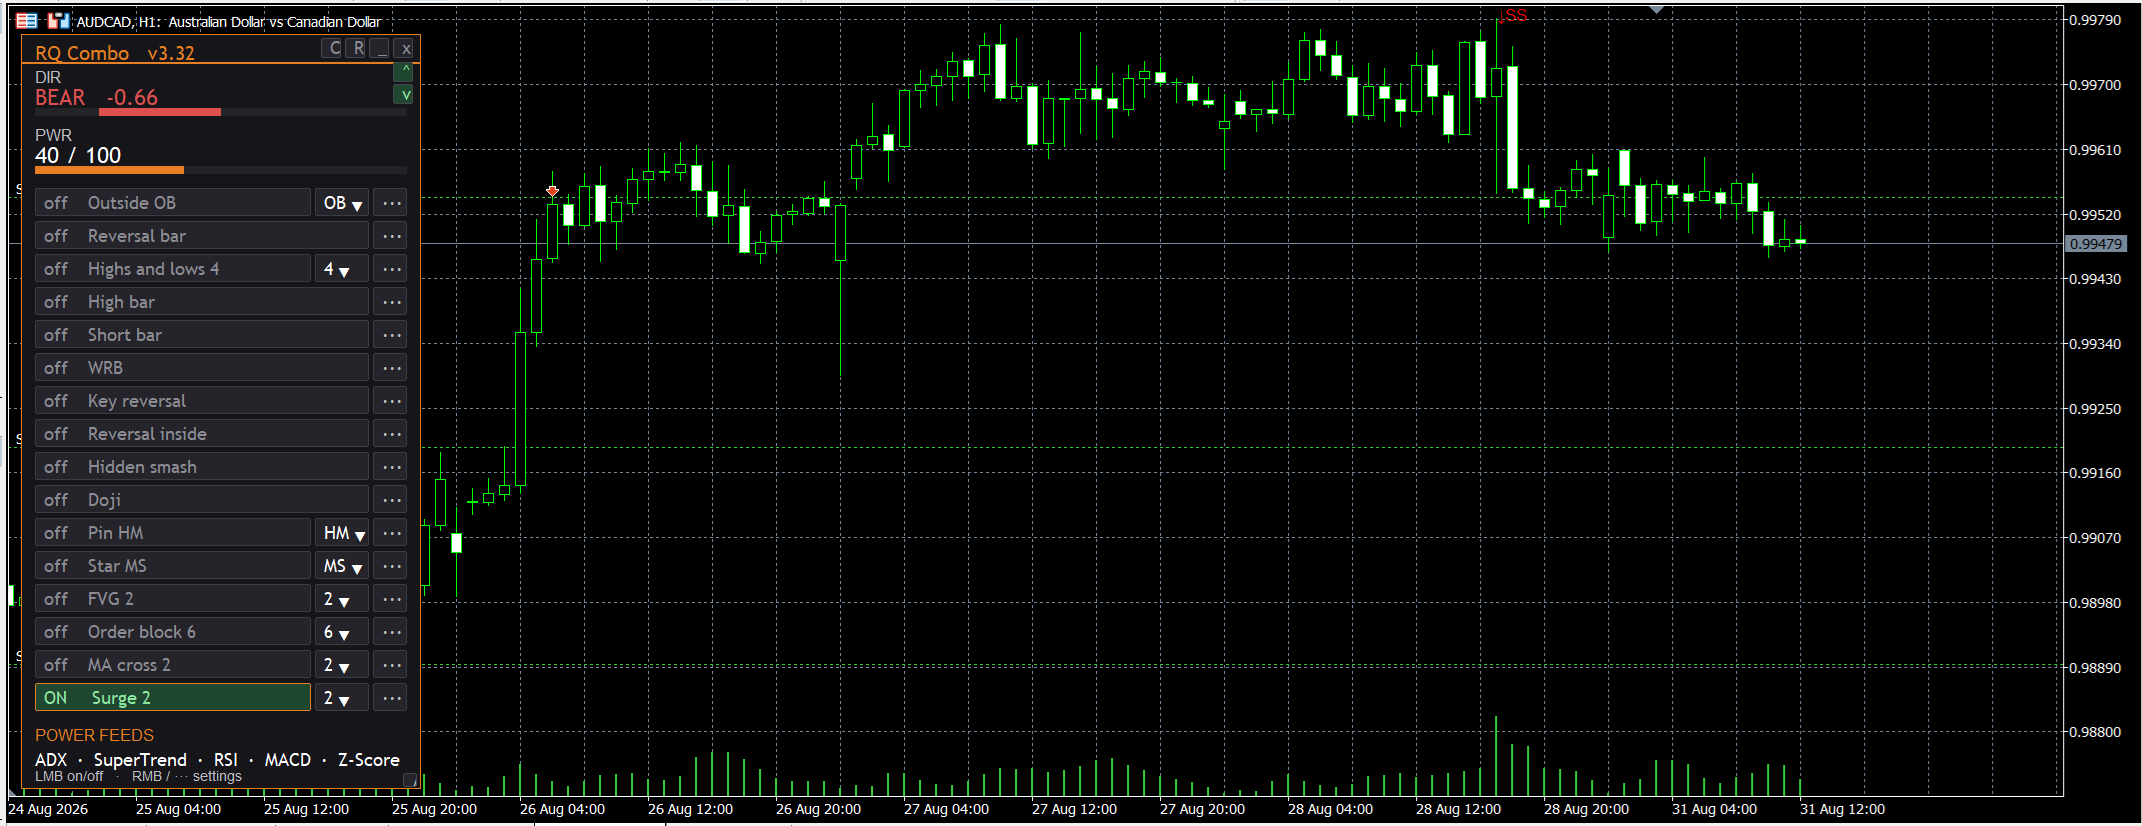
I included that chart deliberately rather than hunting for a flattering one. The supply surge fired near the top of a push, price added roughly another 20 pips against it over the following session, and only then turned. If you had sold the marker you would have been underwater for a day before the move you were right about arrived. That gap between “the reading was correct” and “the trade was survivable” is the whole reason I keep repeating that this is a filter and not a trigger.
This is the same discipline I applied when I published the Z-Score trading indicator: define the statistic precisely, test the payoff honestly, and describe what it does rather than what it might do. It is also why my systematic work, like the intraday volatility breakout strategy and its v4 revision, lives on explicit rules with published equity curves rather than on discretionary pattern spotting.
Where the surge fits in a wider process
I use volume and volatility tools for context, and I keep the directional decision somewhere else. Macro regime comes from the slower work I do on leading economic indicators. Longer-horizon allocation follows systematic rules like the Nasdaq 100 momentum approach. Intraday, the surge detector answers a narrower question: has anything genuinely unusual happened on this bar, or am I about to trade noise? The cumulative DIR and PWR readout sitting above it covers the layer in between, telling me whether the five power feeds currently agree on a direction and how strongly, so the bar-level signal is never read in isolation.
That framing keeps expectations sane. A demand and supply surge is a well-defined measurement of one-sided participation on a closed bar, built from the only volume data MT5 actually has. It will not turn a losing approach into a winning one. It will stop you from mistaking a routine bar for a real shift in who is in control.
Conclusion
True order flow needs a central book, a consolidated tape, and an aggressor flag. Retail MT5 gives you none of those, and any tool claiming otherwise is inferring rather than measuring. The demand and supply surge detector is upfront about that: four transparent closed-bar conditions, one optional OBV confirmation, and no repainting.
Switch it on from the DETECTION list, keep both directions selected until you know what your instrument looks like, and adjust the ATR multiple before you touch anything else. Watch how price behaves after each marker on your own symbol and timeframe for a couple of weeks before you let it influence a live decision.
Then hold it to the standard I hold it to. It tells you where the market got impatient. Deciding whether that impatience was right is still your job.
Run the surge detector on your own charts
The demand and supply surge is one of eighteen detectors in the RavenQuant Combo Dashboard, and it sits directly under the panel’s cumulative DIR and PWR readout so you always see the bar and the regime together. Same philosophy throughout: closed bars only, thresholds you can see and change, and no claim to measure order flow that MetaTrader 5 cannot deliver.
Get the RavenQuant Combo Dashboard for MT5Cumulative trend direction and power, eighteen detectors, volume profile and swing trend lines in a single dockable panel.
FAQ: demand and supply surge in MT5
What is a demand and supply surge in trading?
It is a single bar showing aggressive one-sided participation: a range much wider than recent volatility, a body that dominates that range, a close near the extreme, and volume well above the recent average. A demand surge is the bullish case, a supply surge the bearish mirror.
Why do demand and supply surges happen?
Five causes account for most of them: new information forcing everyone to reprice at once, a large participant with execution urgency who must finish today, protective stops converting into market orders after a level breaks, thin liquidity during session handovers or holidays, and a crowded position unwinding.
Those causes fall into two families. Either somebody genuinely wanted in or out, in which case the order is often unfinished and the move has something behind it, or nobody was there and price simply met no resistance. The two produce identical looking candles, so the distinction has to come from context: the calendar, the session, and what the following bars do.
What do DIR and PWR show in the RQ Combo Dashboard?
DIR is a cumulative trend direction from −1.00 to +1.00, averaged across five power feeds: ADX/DMI, SuperTrend, RSI, MACD and Z-Score. It reads BULL above +0.15, BEAR below −0.15 and FLAT in between. PWR is a cumulative strength score from 0 to 100 built from the same feeds, then damped when the feeds disagree, so a conflicted market cannot produce a high power reading.
Both refresh on every closed bar, individual feeds can be excluded, and both are exposed as indicator buffers so an Expert Advisor can read them directly. The surge detector describes one bar; DIR and PWR describe the regime that bar occurred in.
Can MetaTrader 5 show real order flow or delta?
Not on typical retail FX and CFD feeds. There is no consolidated tape, the volume figure is tick count rather than traded size, and many brokers never populate the buy and sell flags on ticks. Anything labelled delta or footprint on such a feed is reconstructed, not measured.
What is the difference between tick volume and real volume?
Tick volume counts how many times the price updated during the bar. Real volume counts contracts or lots traded. In liquid FX pairs the two correlate well enough for relative comparisons, which is why RVOL works, but tick volume is broker specific and should never be read as an absolute size figure.
Does the surge detector repaint?
No. It evaluates closed bars only and never reads the forming candle, so once a marker is printed it stays. The trade-off is that you see the signal at the close of the bar rather than during it.
What settings should I use on lower timeframes?
On M5 and M1 raise both the ATR multiple and the minimum RVOL, to roughly 2.5 each. Tick volume is noisier there and the spread eats a larger share of the average bar. On H1 and above you can relax the ATR multiple to around 1.7 to keep a usable signal count.
Is a demand and supply surge a buy or sell signal?
No, and testing it as one produced nothing better than the cost of trading in my own research. Treat it as a context filter that flags unusual participation, then combine it with structure such as levels, trend, fair value gaps, or order blocks before making a directional decision.