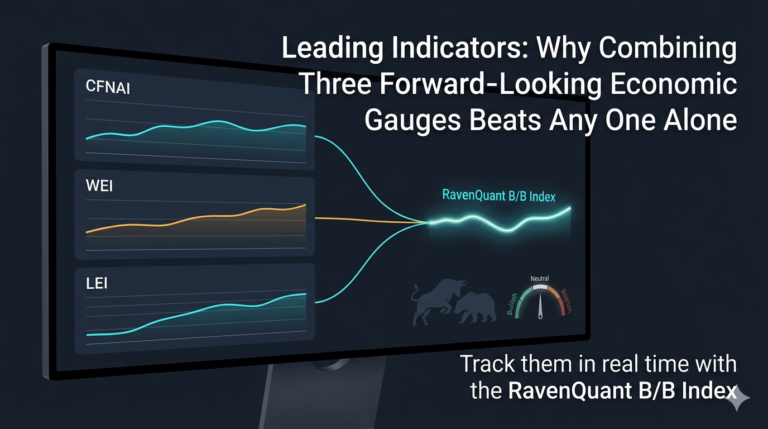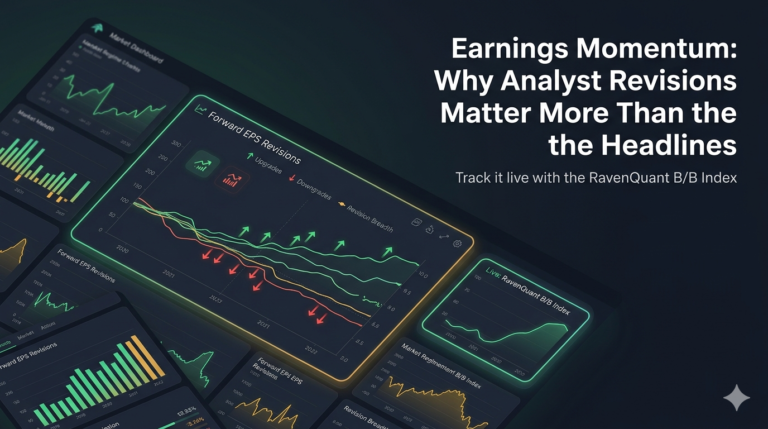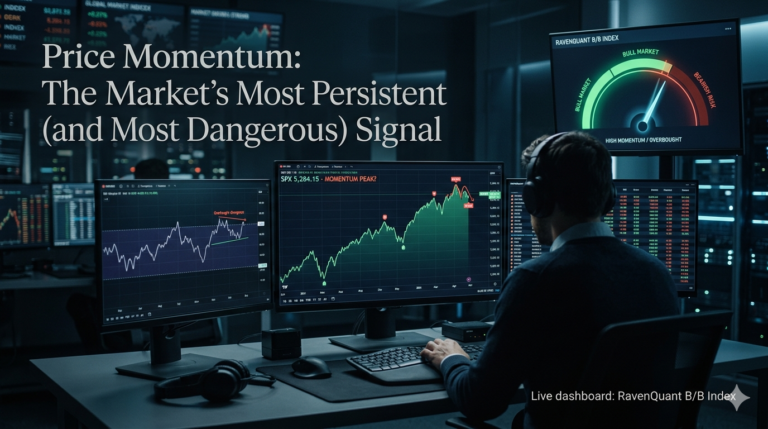
Live dashboard: RavenQuant B/B Index
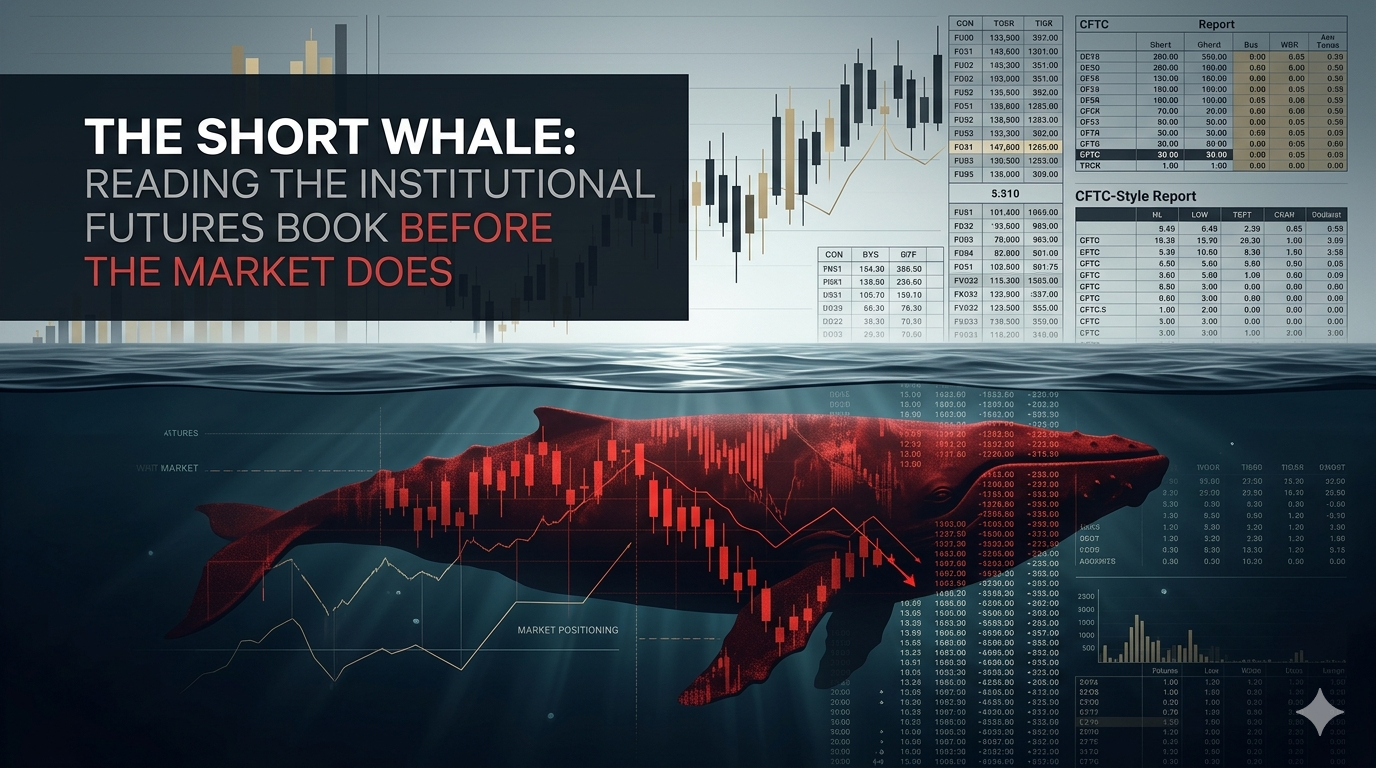
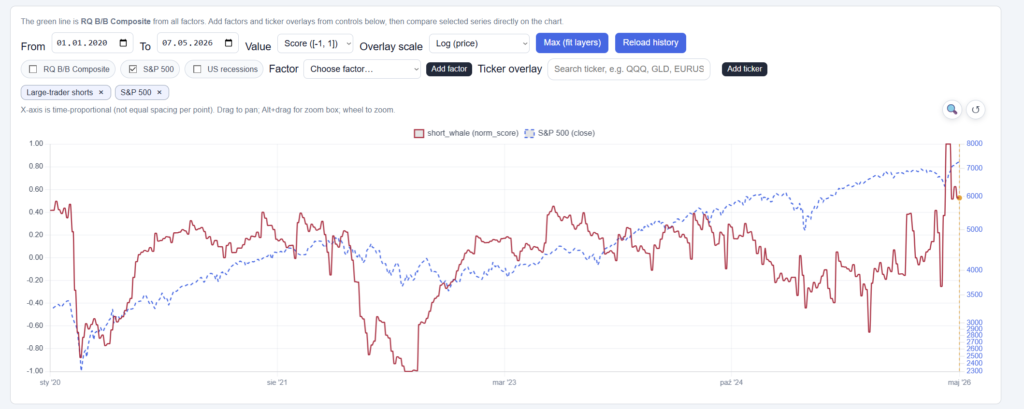
Short Whale is a key market regime signal for investors. There is a dataset published every Friday afternoon that most retail investors have never opened, yet some of the most sophisticated macro traders in the world treat it as required reading. It is the Commitments of Traders report – and specifically, the Traders in Financial Futures (TFF) breakdown – published weekly by the Commodity Futures Trading Commission. It shows, in plain numbers, how the largest institutional players in the world are positioned in S&P 500 futures. When those players pile up a massive net short position, something is either very wrong – or about to get very interesting.
What Institutional Net Shorts Signal About Positioning Risk
How CFTC TFF Positioning Data Is Structured
The CFTC has required large traders to report their positions in futures markets for decades. The legacy COT format groups traders into commercials and non-commercials. The Traders in Financial Futures report – the newer format introduced around 2010 – gives a more useful breakdown for financial futures, splitting participants into four categories: Dealer/Intermediary, Asset Manager/Institutional, Leveraged Funds, and Other Reportables.
For anyone trying to read equity market sentiment, the two most interesting buckets are Asset Managers (pension funds, mutual funds, sovereign wealth funds – the large institutional money that tends to be structurally long equities) and Leveraged Funds (hedge funds – fast money that can go either direction and often has macro views). The report covers E-mini S&P 500 futures, which are the primary tool large institutions use to express market exposure.
The data reflects positioning as of each Tuesday, and it is published the following Friday. There is an inherent lag, which matters in fast-moving markets – but for macro positioning purposes, where structural shifts tend to unfold over weeks, the Tuesday-to-Friday lag is manageable.
How to Read Extreme Positioning and Short-Covering Setups
When large institutional money has positioned itself predominantly on the short side of equity futures, that is the scenario this factor is built to detect. The interpretation can work two ways. A massive buildup of institutional short positioning can be a confirmation signal – large, well-resourced players have done their research and concluded the market is heading lower. It can also be a contrarian signal – when everyone who wants to be short is already short, the potential energy for a sharp upward reversal (a short squeeze) is enormous.
Which reading is correct depends heavily on what the rest of the macro environment looks like. A crowded short in a deteriorating credit environment reads very differently from a crowded short when other macro indicators are turning green. This is precisely why positioning data is most useful as one piece of a broader mosaic rather than a standalone signal.
2022-2023 Case Study: Crowded Shorts and Squeeze Risk
Leveraged funds built extremely large net short positions in S&P 500 futures throughout 2022 as the equity market sold off and macro conditions deteriorated sharply. By the end of 2022, the short positioning among this group was at historically elevated levels, representing a significant bet on continued market weakness.
What happened in January 2023 is instructive. The market reversed sharply to the upside – the S&P 500 gained roughly 6% in January alone. A major contributor to the velocity of that move was short covering: traders who had built large short positions were forced to buy futures back as the market moved against them, which itself accelerated the rally. It was not just fundamental buyers coming in – it was the mechanical pressure of an overcrowded short trade unwinding.
Positioning data from the COT report had been flashing warning signs about this potential squeeze for weeks before it happened. That does not mean the positioning data alone would have told you to buy. But in combination with other signals, it was clearly part of the picture.
How to Compare Asset Managers and Leveraged Funds
Asset managers are structurally long-biased – they own equity portfolios and use futures primarily for hedging, tactical tilts, and liquidity management. When asset managers go net short S&P futures in a meaningful way, it is unusual and worth noting.
Leveraged funds are more volatile in their positioning. They rotate aggressively based on macro views, models, and momentum. Their short positioning alone is somewhat routine – hedge funds short the market frequently. But when both groups are simultaneously net short at elevated levels, that combination is unusual enough to carry real signal. The convergence of fast money and slow money on the same side of a trade is what makes the short whale reading genuinely meaningful rather than just noise.
Limitations and Practical Use
The Tuesday-to-Friday publication lag is the obvious one – by the time you read the data, three trading days have passed and positioning can have shifted substantially, especially in a volatile market. The data also captures positions as of Tuesday’s close, not the full week’s activity. Intraday positioning moves and over-the-counter derivatives are not captured at all. There is also the interpretation problem: heavy short positioning can persist for extended periods without triggering the squeeze scenario, and a factor that fires on crowded-short positioning can be early by weeks or months depending on what catalyzes the eventual reversal. The COT data tells you what large players are doing; it does not tell you why, and the why usually determines how to weight the signal.
How RavenQuant Integrates Short Whale in Real Life
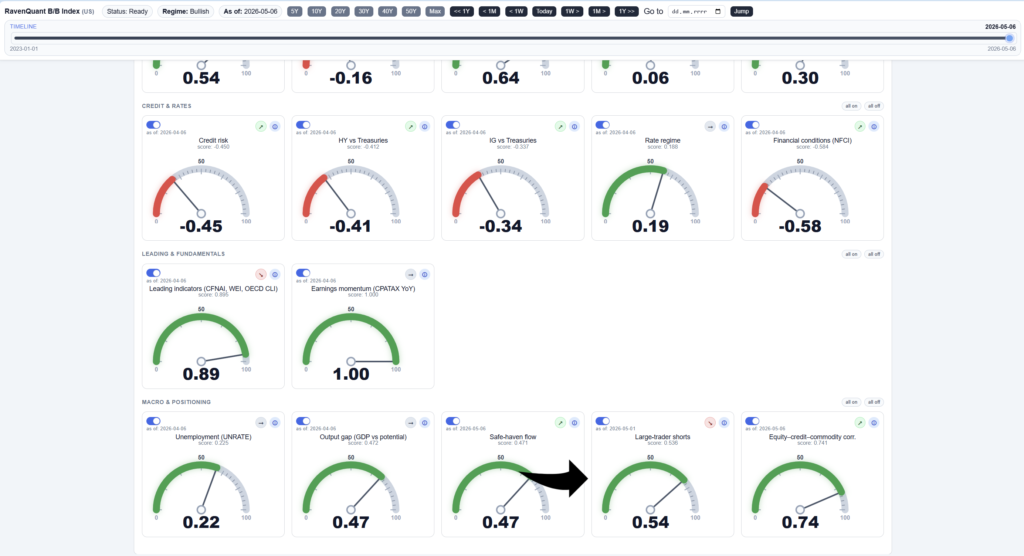
The net positioning of asset managers and leveraged funds in E-mini S&P 500 futures – drawn from the weekly CFTC TFF report – is one of the factors tracked in the RavenQuant B/B Index at ravenquant.com. If you want to see how current institutional futures positioning is scoring in a broader macro context, the dashboard shows it alongside all other signals.
Explore the live index here: https://bull-bear-analyzer-production.up.railway.app