In a previous analysis the ATH-staircase momentum strategy returned a median of +1,269% on the S&P 500 over 25 years. Same entry filter, same 2-month holding period, same equal-weight rule, same 19% batch tax. One question remained: what happens when you point those exact rules at the Nasdaq 100 — a universe built around the hundred largest non-financial companies on the Nasdaq, dominated by technology, semiconductors, and innovation?
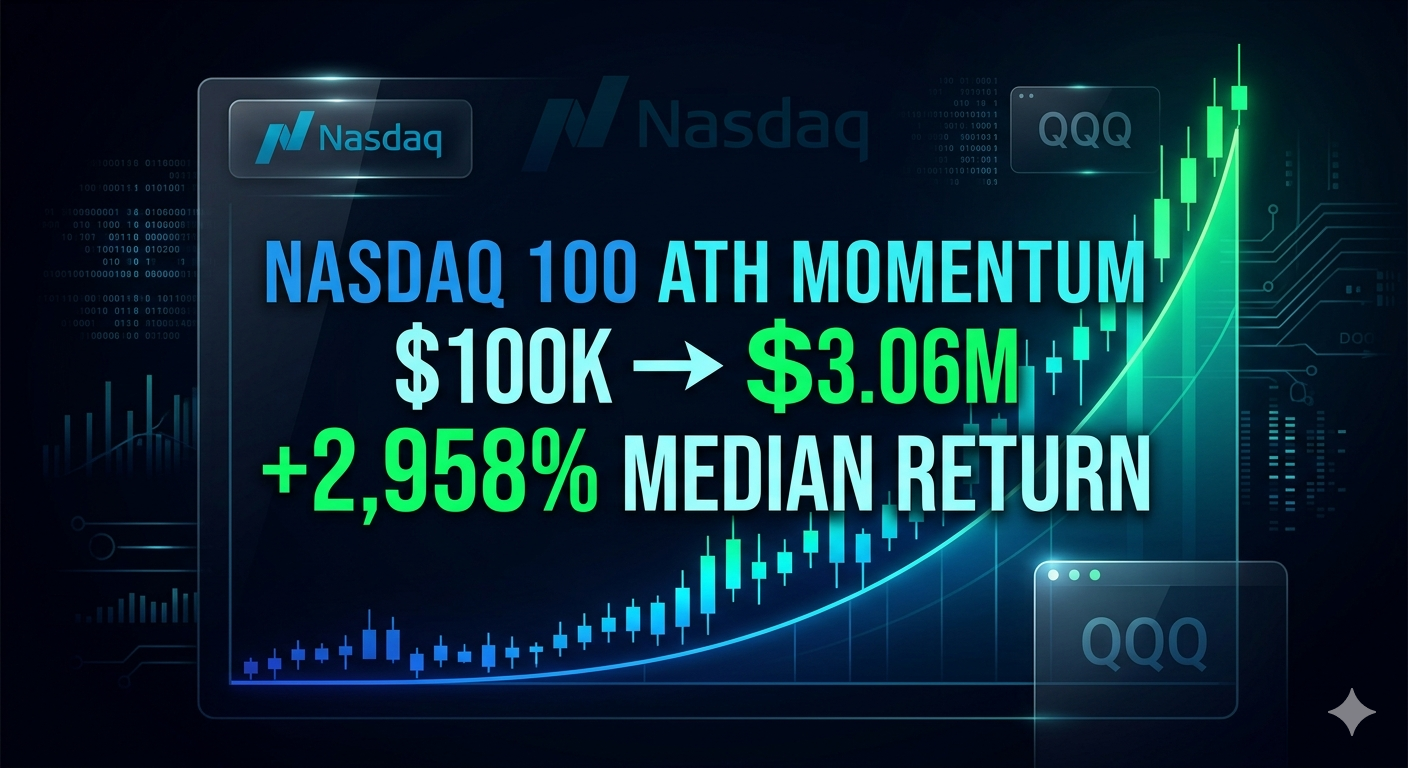
The answer: +2,958% median total return (mean CAGR +13.6%/yr across 20 runs), turning $100,000 into roughly $3.06 million at the median — while a buy-and-hold in QQQ (Invesco Nasdaq 100 ETF), the natural benchmark of the same universe, returned only +615% after tax from the same starting point ($715,000 final). No different rules. No different parameters. Just a richer momentum universe — and beating its own index by +5.3 percentage points per year over 26 years.
The Strategy: Same Rules, Different Universe
The strategy is completely unchanged from the S&P 500 version. Only the stock universe switches — from the current S&P 500 constituents to the current Nasdaq 100 constituents (sourced from Wikipedia). Every other rule is identical:
Entry filter — the ATH staircase
A stock qualifies if it made a new all-time high in each of the previous three consecutive
months, and each month’s peak is at least 5% higher than the prior month’s
peak.
Month 2 ATH ≥ 1.05 × Month 1 ATH · Month 3 ATH ≥ 1.05 × Month 2 ATH.
Portfolio construction
From the qualifying stocks each month, randomly pick up to 5 names and allocate capital equally across them. No discretionary overrides, no fundamental checks — the rule selects, the portfolio holds.
Holding period & exit
Hold each batch for exactly 2 months. Exit on the first trading day of month m+2. No new batch opens while the current one is active. If no stocks qualify after exit, stay flat until the next qualifying set appears.
Tax treatment
19% batch tax on every closed batch: net PnL × 0.81 is added to equity. Losses receive the equivalent tax credit symmetrically. Results shown are fully after-tax. The QQQ benchmark applies its 19% tax once at the very end.
| Rule | Details |
|---|---|
| Universe | Nasdaq 100 (current Wikipedia constituents, split-adjusted prices) |
| Entry filter | 3 consecutive monthly ATHs, each ≥ 5% higher than the last |
| Selection | Randomly pick up to 5 qualifying stocks per batch |
| Position sizing | Equal dollar allocation (1/N per position) |
| Entry | First trading day of month m |
| Exit | First trading day of month m+2 |
| No overlap | No new batch opens until current batch fully exits |
| Tax | 19% on net PnL per batch (symmetric gain/loss) |
| Benchmark | QQQ (Invesco Nasdaq 100 ETF), buy-and-hold, 19% tax at end |
Note: stock and ETF prices sourced from Yahoo Finance. Data may contain minor inaccuracies due to corporate actions, split adjustments, or vendor issues.
Why Nasdaq 100 Is a Natural Fit for Momentum
The Nasdaq 100 is not a random collection of stocks. It represents the 100 largest non-financial companies listed on the Nasdaq, dominated by technology, semiconductors, biotech, and consumer internet. These sectors tend to exhibit stronger and more persistent momentum than the broader market for several structural reasons:
- Winner-take-most dynamics: Tech companies compound via network effects and scalability, so institutional money chases confirmed leaders — reinforcing price trends.
- Earnings acceleration: High-growth companies frequently revise earnings estimates upward, creating a sustained stream of positive surprises that fuel multi-month trends.
- Analyst coverage lag: Emerging tech leaders are often underfollowed at the breakout phase, so price discovery happens gradually — momentum captures this delay.
- Sharper ATH patterns: With higher average growth rates, Nasdaq 100 stocks naturally break to new highs more frequently, providing more entry signals.
The flip side: the same concentration that amplifies upside creates sharper reversals. When the tech leadership theme breaks (as in 2023, when the AI rally was dominated by just a handful of mega-caps, or in 2015 during the biotech correction), the strategy can lag even the QQQ index itself.
Data Preparation
Full sample period: March 2000 – January 2026 (25.8 years)
The backtest begins in early 2000 — right at the peak of the dot-com bubble — making this one of the most unfavorable possible starting points for any momentum strategy on tech stocks. The universe spans all current Nasdaq 100 constituents with price histories available on Yahoo Finance, with daily prices adjusted for splits and dividends.
Stress regimes covered:
- Dot-com bust (2000–2002): Nasdaq 100 fell over 83% peak-to-trough; QQQ lost −38%, −27%, −39% in three consecutive years
- Recovery cycle (2003–2007): broad momentum regime, QQQ +44% in 2003 alone
- Global Financial Crisis (2008): deep cross-asset drawdown, QQQ −41%
- Quantitative tightening cycles (2015, 2018, 2022)
- COVID crash and V-shape recovery (2020): QQQ +46%, strategy +105%
- AI-driven mega-cap concentration (2023): QQQ +56%, strategy −21%
Simulation Design
The simulation was run 20 independent times using different random seeds for the monthly stock selection step (when more than 5 stocks qualify, up to 5 are chosen randomly). All runs follow identical rules — entry filter, holding period, tax — and the results shown are averages across all 20 runs.
With 20 runs, the average provides solid statistical confidence: outlier draws (a single run that happened to pick NVDA in a monster year) are smoothed out, giving a realistic picture of what a systematic investor following these rules would have experienced over time.
The benchmark is a buy-and-hold position in QQQ (Invesco Nasdaq 100 ETF), starting with the same $100,000, compounding annual QQQ total returns, with a single 19% tax applied to the total gain at the very end. Using QQQ — the ETF that tracks the exact same 100-stock universe — makes this an apples-to-apples comparison. There is no hiding behind the easier S&P 500 benchmark here.
Results
Median total return
+2,958%
$100,000 → ~$3,058,320 (median of 20 runs)
Strategy CAGR
13.6% / yr
vs 8.3% / yr for QQQ after-tax
Excess CAGR
+5.3% / yr
Annualised edge over buy-and-hold QQQ
Worst max DD
−31.2%
vs −58.4% for QQQ (2001, dot-com)
| Metric | Strategy (20 runs) | QQQ benchmark | Excess |
|---|---|---|---|
| Median total return (after-tax) | +2,958% | +615% after-tax ($714,924) | +2,343% |
| Median final equity | ~$3,058,320 | $714,924 (after-tax) | ~$2,343,396 |
| Run range | +2,295% – +4,792% | — | — |
| CAGR (mean over 20 runs) | 13.6% / year | 8.3% / year (after-tax) | +5.3% / year |
| Worst max drawdown | −31.2% (2004) | −58.4% (2001, dot-com) | 27.2 pp shallower |
| Period | March 2000 – January 2026 (25.8 years) | ||
| Runs | 20 independent random seeds | ||

The scale of outperformance is substantial. The median run ends at ~$3.06 million versus $715,000 for QQQ buy-and-hold after tax — ~$2.34 million more from the same starting $100,000. The 20-run spread (min +2,295% to max +4,792%) shows that every single run comfortably beat QQQ’s +615% by a wide margin, regardless of which specific stocks were drawn each month.
Year-by-Year Performance (20-Run Average)
| Year | Strategy return | Strategy PnL ($) | Strategy max DD | QQQ return | QQQ PnL ($) | QQQ max DD | Excess return |
|---|---|---|---|---|---|---|---|
| 2000 | −7.54% | −7,540 | −2.5% | −38.39% | −38,390 | −52.7% | +30.9% |
| 2001 | +26.58% | +24,577 | 0.0% | −27.19% | −16,749 | −58.4% | +53.8% |
| 2002 | +34.56% | +40,445 | −2.8% | −39.24% | −17,604 | −51.9% | +73.8% |
| 2003 | +88.24% | +138,956 | −1.8% | +43.60% | +11,884 | −12.2% | +44.6% |
| 2004 | +8.40% | +24,729 | −31.2% | +10.84% | +4,244 | −15.9% | −2.4% |
| 2005 | +75.46% | +242,368 | −1.3% | +2.65% | +1,148 | −12.2% | +72.8% |
| 2006 | −2.53% | −13,656 | −8.9% | +4.81% | +2,142 | −17.3% | −7.3% |
| 2007 | +48.06% | +264,245 | −5.5% | +18.81% | +8,778 | −11.4% | +29.3% |
| 2008 | −20.45% | −166,506 | −16.1% | −40.79% | −22,619 | −49.4% | +20.3% |
| 2009 | +5.45% | +35,326 | −9.0% | +48.25% | +15,843 | −18.3% | −42.8% |
| 2010 | +13.50% | +92,309 | −3.1% | +18.41% | +8,961 | −15.6% | −4.9% |
| 2011 | +21.70% | +168,446 | −9.4% | +1.89% | +1,087 | −16.1% | +19.8% |
| 2012 | −13.12% | −123,513 | −22.7% | +15.89% | +9,332 | −11.6% | −29.0% |
| 2013 | +30.29% | +249,451 | −7.4% | +32.43% | +22,067 | −5.9% | −2.1% |
| 2014 | −6.39% | −66,990 | −16.5% | +20.12% | +18,136 | −8.2% | −26.5% |
| 2015 | −19.28% | −193,349 | −18.5% | +9.77% | +10,572 | −13.9% | −29.1% |
| 2016 | +19.40% | +157,940 | −0.8% | +9.41% | +11,177 | −12.0% | +10.0% |
| 2017 | +32.25% | +310,856 | −0.7% | +31.49% | +40,935 | −4.9% | +0.8% |
| 2018 | −1.46% | −18,718 | −4.7% | −1.85% | −3,157 | −22.8% | +0.4% |
| 2019 | +6.33% | +78,417 | −13.4% | +38.41% | +64,438 | −11.0% | −32.1% |
| 2020 | +105.13% | +1,409,067 | −6.7% | +45.97% | +106,750 | −28.6% | +59.2% |
| 2021 | +22.46% | +609,714 | −9.9% | +29.24% | +99,132 | −10.9% | −6.8% |
| 2022 | −10.21% | −342,652 | 0.0% | −33.22% | −145,538 | −34.8% | +23.0% |
| 2023 | −20.57% | −619,939 | −11.6% | +55.91% | +163,573 | −10.8% | −76.5% |
| 2024 | −3.67% | −87,225 | −20.7% | +27.74% | +126,533 | −13.6% | −31.4% |
| 2025 | −6.14% | −140,091 | 0.0% | +21.01% | +122,415 | −22.8% | −27.2% |
| 2026* | +47.95% | +1,038,831 | 0.0% | +21.85% | +154,078 | −11.7% | +26.1% |
* 2026 is a partial year (through January 2026). Green = strategy outperforms QQQ. Red = strategy underperforms or both negative.

Standout Years: The Highs and the Lows
2020: +105.1% — the COVID momentum wave
The single most important year in the simulation. While QQQ returned +46.0% and suffered a −28.6% intra-year drawdown during the March crash, the strategy — rolling positions in momentum names as tech demand exploded — caught the ferocious rebound. The average run earned over 105% in a single calendar year, adding over $1.4 million to an account that had grown from $100,000 to around $1.34 million by end of 2019. This is the compounding engine at maximum power.
2001–2002: Surviving the dot-com bust
The strategy started investing in March 2000 — the top of the Nasdaq bubble. The first batch produced losses as the market turned. But the strategy’s discipline worked: when momentum signals dried up in the collapsing market, few batches formed. QQQ lost −27% in 2001 and −39% in 2002, with intra-year drawdowns exceeding −58%. The strategy returned +26.6% in 2001 and +34.6% in 2002. The two-year excess of roughly +54 and +74 percentage points over the index is the single biggest alpha event in the dataset — and it arrived at the worst possible time for buy-and-hold investors.
2003: +88.2% — the recovery momentum
After the bust, surviving Nasdaq leaders re-accelerated sharply. QQQ itself rallied +43.6% as the index recovered from its lows. The strategy captured an even bigger +88.2%, landing on names like GRMN (+34.4% in one batch), AXON (+64.5% in December 2003), and GILD (+28.1%). The average run nearly doubled in a single year off the wrecked 2000–2002 base.
2023: −20.6% while QQQ gained +55.9%
The worst relative year in the dataset — and the starkest illustration of the strategy’s limitation. The 2023 AI rally was almost entirely concentrated in Nvidia, Microsoft, Apple, Meta, and Alphabet. These mega-caps drove QQQ’s exceptional +55.9% gain. The ATH staircase filter — requiring three consecutive months of +5% new highs — may miss sharp vertical rallies that don’t spread across Nasdaq 100 breadth, while the random pick of 5 from qualifying names can miss the narrow set of true leaders. With a universe of 100 stocks and a strict momentum filter, one or two bad batches can define the year.
Bear Market Behaviour
Across the major stress regimes in the dataset, the strategy’s behaviour consistently limits downside versus QQQ — often dramatically. The QQQ benchmark, being entirely in tech, suffers deeper crashes than SPY in most risk-off periods:
- 2001–2002 (dot-com bust): Strategy +26.6% and +34.6% vs QQQ −27.2% and −39.2%. QQQ’s intra-year max DD reached −58.4% (2001) and −51.9% (2002). When Nasdaq stocks stopped making new all-time highs, the strategy simply stopped trading — staying flat is a feature, not a bug. The 2001–02 alpha is what ultimately drives the long-run outperformance.
- 2008 (GFC): Strategy −20.5% vs QQQ −40.8%. Both fall; the strategy falls roughly half as much. Worst intra-year drawdown: −16.1% vs −49.4% for QQQ. The strategy loses money but avoids the catastrophic halving that destroyed buy-and-hold wealth.
- 2018 (rate fears): Strategy −1.5% vs QQQ −1.9%. Essentially tied on returns, but the strategy’s max DD of −4.7% compares favourably to QQQ’s −22.8% intra-year move.
- 2022 (rate hike cycle): Strategy −10.2% vs QQQ −33.2%. The strategy lost roughly a third as much as QQQ, with 0% reported intra-year drawdown on the 20-run average.
- 2023 (AI mega-cap rally): Strategy −20.6% vs QQQ +55.9%. The worst relative year — and the clearest demonstration that the strategy’s ATH filter can miss concentrated vertical momentum events. Unlike the crash years, here the strategy actively lost money while QQQ roared.
| Year / regime | Strategy return | QQQ return | Strat max DD | QQQ max DD | Edge |
|---|---|---|---|---|---|
| 2001 (dot-com) | +26.6% | −27.2% | 0.0% | −58.4% | Extreme safety advantage |
| 2002 (dot-com) | +34.6% | −39.2% | −2.8% | −51.9% | Extreme safety advantage |
| 2008 (GFC) | −20.5% | −40.8% | −16.1% | −49.4% | Meaningfully safer |
| 2018 (rates) | −1.5% | −1.9% | −4.7% | −22.8% | Much shallower max DD |
| 2022 (rates) | −10.2% | −33.2% | 0.0% | −34.8% | One-third the loss of QQQ |
| 2023 (AI rally) | −20.6% | +55.9% | −11.6% | −10.8% | Worst relative year |
Where the Alpha Actually Comes From
Looking at the full 27-year record, it is clear that the strategy’s long-run advantage over QQQ does not come from outperforming QQQ every year. In fact, in the strong bull years — when the tech sector runs hard and broad — QQQ frequently beats the strategy:
- 2009: Strategy +5.5% vs QQQ +48.3% (miss of the post-GFC recovery)
- 2019: Strategy +6.3% vs QQQ +38.4% (missed the broad tech re-rating)
- 2023: Strategy −20.6% vs QQQ +55.9% (the AI mega-cap miss)
The alpha is asymmetric: it is earned almost entirely in the crash and consolidation years, where the ATH filter simply goes quiet. The strategy doesn’t trade when nothing qualifies — and those periods of inactivity are the alpha. Compounding from a +26% year (2001) when the index was −27% creates a base that decades of reinvestment multiply.
Sample Trades
Below are selected trades illustrating the breadth of names that qualify for the ATH staircase filter — from early post-bubble survivors to COVID momentum plays, cybersecurity leaders, and AI supply-chain beneficiaries.
| Batch | Ticker | Buy date | Sell date | Buy price | Sell price | PnL ($) | Return % |
|---|---|---|---|---|---|---|---|
| 2020-05 | ZM | 2020-05-01 | 2020-07-01 | $138.56 | $259.13 | +659,847 | +87.0% |
| 2020-07 | ZM | 2020-07-01 | 2020-09-01 | $259.13 | $457.69 | +341,158 | +76.6% |
| 2020-11 | CRWD | 2020-11-02 | 2021-01-04 | $124.47 | $200.49 | +308,062 | +61.1% |
| 2021-07 | FTNT | 2021-07-01 | 2021-09-01 | $48.47 | $61.69 | +888,215 | +27.3% |
| 2025-11 | LITE | 2025-11-03 | 2026-01-02 | $199.58 | $386.11 | +379,423 | +93.5% |
| 2026-01 | LITE | 2026-01-02 | 2026-03-02 | $386.11 | $783.25 | +857,287 | +102.9% |
| 2026-01 | WDC | 2026-01-02 | 2026-03-02 | $187.61 | $269.95 | +365,806 | +43.9% |
| 2025-02 | UAL | 2025-02-03 | 2025-04-01 | $104.83 | $68.20 | −893,167 | −34.9% |
| 2023-03 | STLD | 2023-03-01 | 2023-05-01 | $123.14 | $99.98 | −647,945 | −18.8% |
| 2024-06 | DELL | 2024-06-03 | 2024-08-01 | $127.81 | $105.33 | −468,541 | −17.6% |
The trades paint a consistent picture. The strategy’s biggest wins come when it catches a genuine multi-month momentum wave: ZM doubled twice in consecutive batches during the COVID work-from-home explosion; LITE nearly tripled across two consecutive batches in late 2025–early 2026 (an AI optical-networking play); FTNT and CRWD were early legs of the enterprise cybersecurity expansion. The biggest losses arrive when a momentum run reverses sharply mid-batch: UAL’s −34.9% in early 2025, STLD’s −18.8% in 2023’s industrial correction.
How to Trade This Strategy Live on Nasdaq 100
- End of each month — screen the Nasdaq 100:
- For every current Nasdaq 100 constituent, look at the last 3 calendar months of daily prices.
- The stock qualifies if it made a new all-time high in each of those 3 months AND each monthly ATH is ≥ 5% above the prior month’s ATH.
- First trading day of the new month — open a batch:
- From the qualifying list, randomly pick up to 5 names.
- Deploy 100% of available equity, equally split (1/N per position).
- Hold 2 months:
- Do not add new positions mid-batch. Do not cut early unless you have a hard stop rule.
- Exit and rescan:
- Sell all positions on the first trading day of month m+2.
- Immediately rescan. If new qualifiers exist, open a new batch. If not, stay flat.
The Nasdaq 100 constituent list changes roughly quarterly. Using the current list (survivorship bias) slightly overstates historical results, as some names that are now in the index weren’t there during the early years. This is a known limitation of all constituent-based backtests.
Want the Python script that implements this end-to-end — monthly ATH detection, random selection, batch tracking, and tax-adjusted equity curve for any universe? Contact me at in**@********nt.com.
Nasdaq 100 vs S&P 500: Which Universe Wins?
Running the identical strategy on two universes over a similar period produces a clear result (full S&P 500 results in the original article):
| Metric | Nasdaq 100 strategy | S&P 500 strategy |
|---|---|---|
| Median total return (after-tax) | +2,958% | +1,269% |
| CAGR (mean over runs) | 13.6% / yr | 11.1% / yr |
| Worst max DD | −31.2% (2004) | −25.1% |
| 2001–02 outperformance | Strongly positive vs QQQ | Strongly positive vs SPY |
| 2023 (AI rally) | −20.6% (strategy), QQQ +55.9% | −10.3% (strategy), SPY +26.7% |
| 2020 (COVID rebound) | +105.1% (strategy), QQQ +46% | ~+30% (strategy), SPY +17% |
| Simulation runs | 20 | 30 |
| Benchmark used | QQQ (same universe) | SPY (broad market) |
The Nasdaq 100 universe delivers higher absolute returns but with higher year-to-year variance and a tougher benchmark comparison. The S&P 500 version provides a smoother ride with a shallower worst drawdown (−25.1% vs −31.2%) and is compared against the easier SPY benchmark. Neither is strictly “better” — it depends on the investor’s tolerance for large annual swings and their view on whether tech-sector momentum will continue to dominate over the next decade.
Conclusion
Applied to the Nasdaq 100 universe over 25.8 years — including the dot-com bust, the GFC, COVID, and the AI era — the same three-month, +5% ATH momentum strategy turned $100,000 into roughly $3.06 million at the median across 20 runs (min $2.40M, max $4.89M), while a buy-and-hold in QQQ — the natural benchmark of the same universe — returned $715,000 after tax from the same starting point.
The strategy beats its own universe’s index by +5.3 percentage points per year (mean CAGR 13.6% vs QQQ 8.3% after-tax), compounded over 25.8 years. This is not explained by taking on more risk in bull markets — in fact, the strategy significantly underperforms QQQ in several strong bull years (2009, 2019, 2023). The edge is almost entirely derived from crash avoidance: when Nasdaq stocks stop making accelerating all-time highs, the strategy goes quiet, sidestepping the worst of the dot-com bust, the GFC, and the 2022 rate shock. The worst strategy drawdown (−31.2% in 2004) is less than half of QQQ’s worst intra-year drawdown of −58.4% in 2001.
The cost is real: two years (2015 and 2023) where the strategy lost roughly 20% while QQQ was strongly positive, and the occasional very bad batch (UAL −34.9% in 2025) that can sting at large equity levels. Investors who can tolerate that kind of divergence — and understand that the strategy earns its alpha in bear markets, not bull markets — will find the Nasdaq 100 universe a powerful amplifier of the underlying momentum edge.