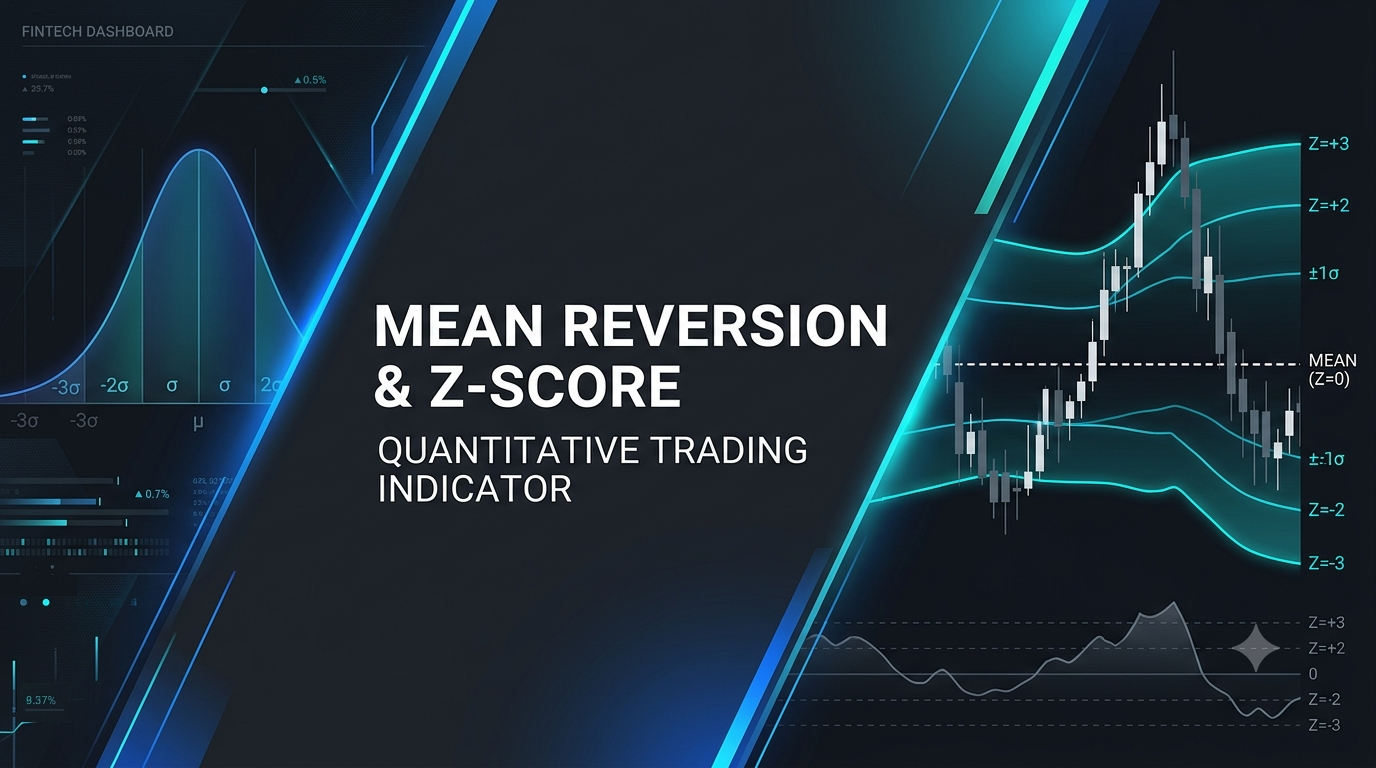
I get asked about mean reversion strategies a lot. Every retail trader loves the idea of buying low and selling high, but in practice, they usually end up catching falling knives. They load up their charts with standard oscillators like the Relative Strength Index (RSI) or Stochastics, wait for the line to cross into overbought or oversold territory, and place a counter-trend trade. Then, they watch in horror as the market continues to trend strongly, pinning the oscillator at the extreme for days while their account gets wiped out. That is where the z-score trading indicator comes in. It uses standard deviations to measure price distance from the mean, giving you a volatility-aware tool that does not get stuck at the boundaries.
When you look at the math behind market movements, prices spend the vast majority of their time consolidating in ranges. But when a violent, news-driven breakout occurs, standard indicators fail because they lack a dynamic volatility component. I wanted a tool that could adapt to changing market conditions in real-time, which is why I developed and now sell a premium, fully-featured version of this statistical tool, Z-Score Spring v2, for MetaTrader 5. By measuring price stretch in units of standard deviation, we can identify genuine institutional exhaustion points rather than just guessing where the turn will be.
Normal Range
95.4%
Of price action stays within +/- 2.0 standard deviations
Extreme Limit
+/- 3.0
A major statistical anomaly representing exhaustion
Trend Filter
ADX < 25
Ensures mean reversion is traded only in ranges
Platform Support
MT5
Premium tool with dynamic bands and alert dashboard
What is a z-score? The math behind the indicator
Let us start with the core concept. A Z-score is a standard statistical measure that tells you exactly how far a data point is from the average of a dataset, expressed in units of standard deviation. In trading, the data point is the current close price, the average is a simple moving average, and the dataset is the historical lookback window. The mathematical formula is simple:
Z = (Current Price – SMA) / Standard Deviation
To understand why this formula is so powerful, we have to look at the three main components:
- Current Price: The closing price of the current bar. This is the raw market data we want to evaluate.
- Simple Moving Average (SMA): The dynamic mean of the price over a chosen lookback period (typically 20 bars). This represents the statistical equilibrium of the market.
- Standard Deviation: The rolling measurement of market volatility over that identical lookback period. It tells us how much the price typically fluctuates around its average.
When you divide the absolute price distance from the average by the standard deviation, you get a normalized, unit-free number. A Z-score of 0.0 means the price is trading exactly at its moving average. A Z-score of +2.0 means the price is currently two standard deviations above its moving average, while a Z-score of -2.0 means it is two standard deviations below. Because it is normalized, you can apply the exact same thresholds to EURUSD, Bitcoin, or the S&P 500, and the statistical meaning remains identical.
Why standard oscillators fail where the z-score excels
Traditional oscillators like RSI or Stochastics are bound by a fixed scale of 0 to 100. This design is highly flawed because it forces the indicator to normalize price action within a rigid, artificial box. When a strong trend develops, the price moves persistently in one direction, and the oscillator quickly hits its upper or lower limit. It gets stuck there, giving repeated overbought or oversold signals while the market keeps moving against you. This is how retail traders get run over trying to short a strong bull market or buy a falling knife.
Unlike traditional oscillators, the z-score trading indicator has no upper or lower bounds. It is a free-floating statistical measure. If a market goes into a massive, parabolic trend, the Z-score can print values of +4.0, +5.0, or even higher. More importantly, because the standard deviation in the denominator is rolling and reactive, it expands during high-volatility moves. When a currency pair makes a violent extension, the standard deviation widens, which mathematically compresses the Z-score downward. This compression is a built-in safety feature: it prevents the indicator from flagging a move as extreme too early, keeping you out of dangerous counter-trend trades during the initial phase of a breakout.
How to trade mean reversion using the z-score trading indicator
Trading mean reversion successfully requires a strict, rules-based process. You cannot simply buy every time the Z-score drops below -2.0 and hope for the best. You need to combine statistical extremes with price confirmation and structural filters. Just as we use rigorous, data-driven backtesting to separate market myths from reality, like we did in our S&P 500 index addition strategy analysis or our S&P 500 dividend stocks study, we have to look at the raw data and apply strict rules when evaluating technical setups.
Here is the core execution blueprint for trading mean reversion with the Z-score:
The Long Setup (Buying Undervalued Markets)
1. Identify the Extreme: Wait for the Z-score to drop below -2.0 (or -3.0 for highly conservative setups), showing that the price is statistically oversold.
2. Filter the Trend: Confirm that the Average Directional Index (ADX) is below 25, ensuring the market is in a range-bound or weak-trend regime.
3. Wait for Confirmation: Do not buy immediately. Wait for the Z-score to cross back above the -2.0 threshold, or wait for a bullish reversal candle (like a pin bar) to print on the price chart.
4. Manage the Trade: Place your stop loss just below the recent swing low. Your primary target is the mean (Z-score of 0.0), where you should take at least partial profits.
The Short Setup (Selling Overvalued Markets)
1. Identify the Extreme: Wait for the Z-score to rise above +2.0 (or +3.0), showing that the price is statistically overextended to the upside.
2. Filter the Trend: Confirm that the ADX is below 25, indicating that the upward move is likely an exhaustion spike rather than a structural trend breakout.
3. Wait for Confirmation: Wait for the Z-score to cross back below the +2.0 threshold, or wait for a bearish reversal candle to print at the highs.
4. Manage the Trade: Place your stop loss just above the recent swing high. Set your take profit target at the dynamic mean (Z-score of 0.0) or the opposite deviation band.
The most important part of this strategy is the trend filter. Mean reversion works beautifully when the market is range-bound, but it is deadly during strong trends. If you try to short a market with an ADX of 45 just because the Z-score is at +3.0, you are going to get run over. The trend strength will override the local technical deviation. In quantitative finance, we often talk about the importance of having a clear, rules-based plan rather than holding onto losing positions in the hope of a miracle, a psychological trap we explored in our guide on why the hold until break even mindset destroys returns. The Z-score gives you a hard, mathematical line in the sand: if the price continues to stretch past your threshold without confirming a turn, you must accept the loss and move on.
Visualizing the statistical edge: The normal distribution
To understand why these thresholds work, we have to look at the normal distribution bell curve. In statistics, if a dataset follows a normal distribution, roughly 68.2% of all data points fall within one standard deviation (+/- 1.0) of the mean. A massive 95.4% of all data points fall within two standard deviations (+/- 2.0), and 99.7% fall within three standard deviations (+/- 3.0). While financial market prices are not perfectly normally distributed (they have fat tails, meaning extreme events happen more often than pure theory predicts), these statistical boundaries still hold immense practical value.
When the Z-score moves beyond +/- 2.0, the price has entered a region that historically contains less than 5% of all price observations. It is mathematically stretched. When it reaches +/- 3.0, it is in a zone that represents less than 0.3% of historical observations. This is a statistical rubber band: the further it stretches, the greater the force pulling it back toward the mean. By using the z-score trading indicator, you are trading with the laws of probability on your side, rather than relying on gut feeling or subjective chart patterns.
Get our premium Z-Score Spring v2 Indicator for MetaTrader 5
While the basic Z-score formula is straightforward, implementing it in a way that is actually useful for real-time trading is a different story. A raw Z-score line in a separate subwindow is hard to read and easily missed during active market sessions. That is why I built Z-Score Spring v2, a professional, institutional-grade mean reversion oscillator available for purchase on the MQL5 Market. It is designed to turn raw statistical math into highly actionable, visual trading signals directly on your MetaTrader 5 charts.


Here is what makes Z-Score Spring v2 different from any free version you will find online:
- Closed-Bar Entry Arrows (v2.08): The indicator prints clear buy and sell arrows directly on your price chart and inside the indicator subwindow. These arrows confirm setups on bar close, ensuring they never repaint or shift after the fact.
- Dynamic Momentum Line Colors: The oscillator line changes colors dynamically based on the speed and direction of the price stretch, helping you visualize when momentum is slowing down and mean reversion is about to begin.
- Configurable Levels (Entry, Exit, Dead Zone): Customize your trading thresholds. You can set independent levels for entering a trade (e.g., +/- 2.0 standard deviations), exiting a trade (e.g., +/- 1.0), or defining a neutral “dead zone” where no trades are taken.
- Fast O(1) Performance: Built with highly optimized, zero-lag code, the indicator calculates values instantly without slowing down your terminal, even when running on multiple charts or during high-impact news events.
- EA-Ready Buffers (iCustom): For algorithmic traders, all signals and values are exposed via standard indicator buffers. You can easily integrate Z-Score Spring v2 into your custom Expert Advisors (EAs) using the `iCustom` function.
Get Z-Score Spring v2 on the MQL5 Market Now
The honest verdict: Is the z-score indicator right for you?
Let us be completely honest: no indicator is a magic bullet. The Z-score is a statistical tool, and statistics are about probabilities, not absolute guarantees. During a major structural market shift, such as a central bank rate decision or a black swan event, prices can remain highly overextended for longer than any historical model predicts. If you trade without a stop loss or ignore trend filters, even the best statistical tool will not save your account.
But if you are a disciplined trader who understands risk management, the z-score trading indicator is a massive upgrade over traditional oscillators. It removes subjectivity from your trading, replacing vague “overbought” feelings with hard, mathematical standard deviations. It tells you exactly when a market is stretched to a true statistical limit, and more importantly, when to stand aside. If you want to see how we use systematic, code-based execution to find a real edge in other market regimes, check out our automated intraday volatility breakout strategy or our 26-year backtest of the Nasdaq 100 momentum strategy. For long-term equity exposure, we also analyzed how the GARP ETF uses multi-factor scoring to build a high-quality portfolio. Stop guessing the market and start trading with statistical precision today.