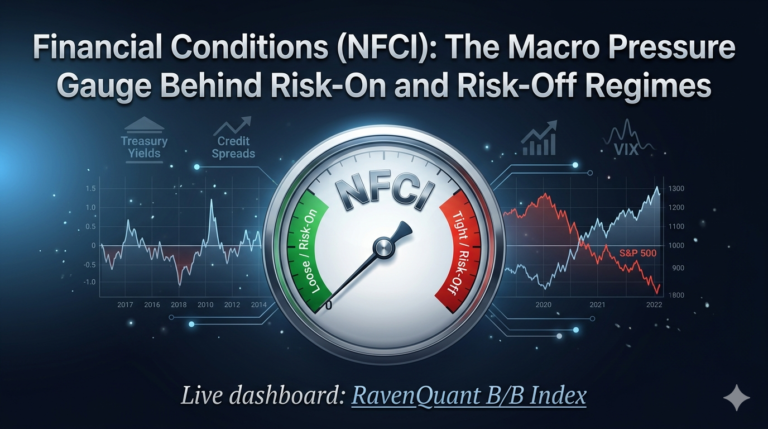
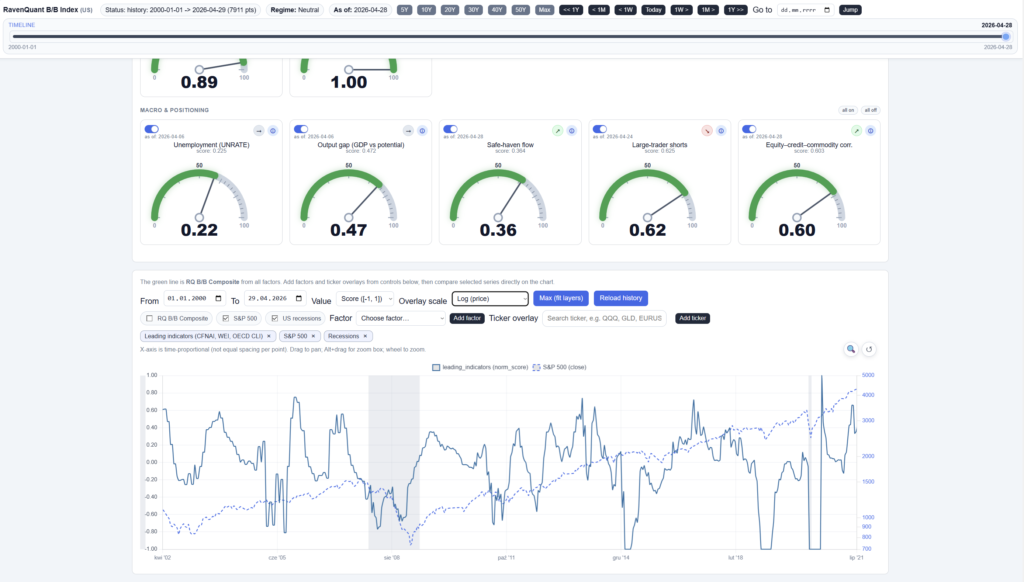
Live dashboard: RavenQuant B/B Index
Most economic data is a rearview mirror. GDP comes out weeks after the quarter ends. Employment reports measure conditions from the previous month. Even “flash” estimates of PMI or consumer confidence are measuring what already happened. Leading indicators are different — they’re constructed specifically to tell you where the economy is heading, not where it’s been. The challenge is that no single leading indicator is reliable enough on its own to trade confidently. Combining them, at different time frequencies and covering different sectors, is where the signal gets useful.
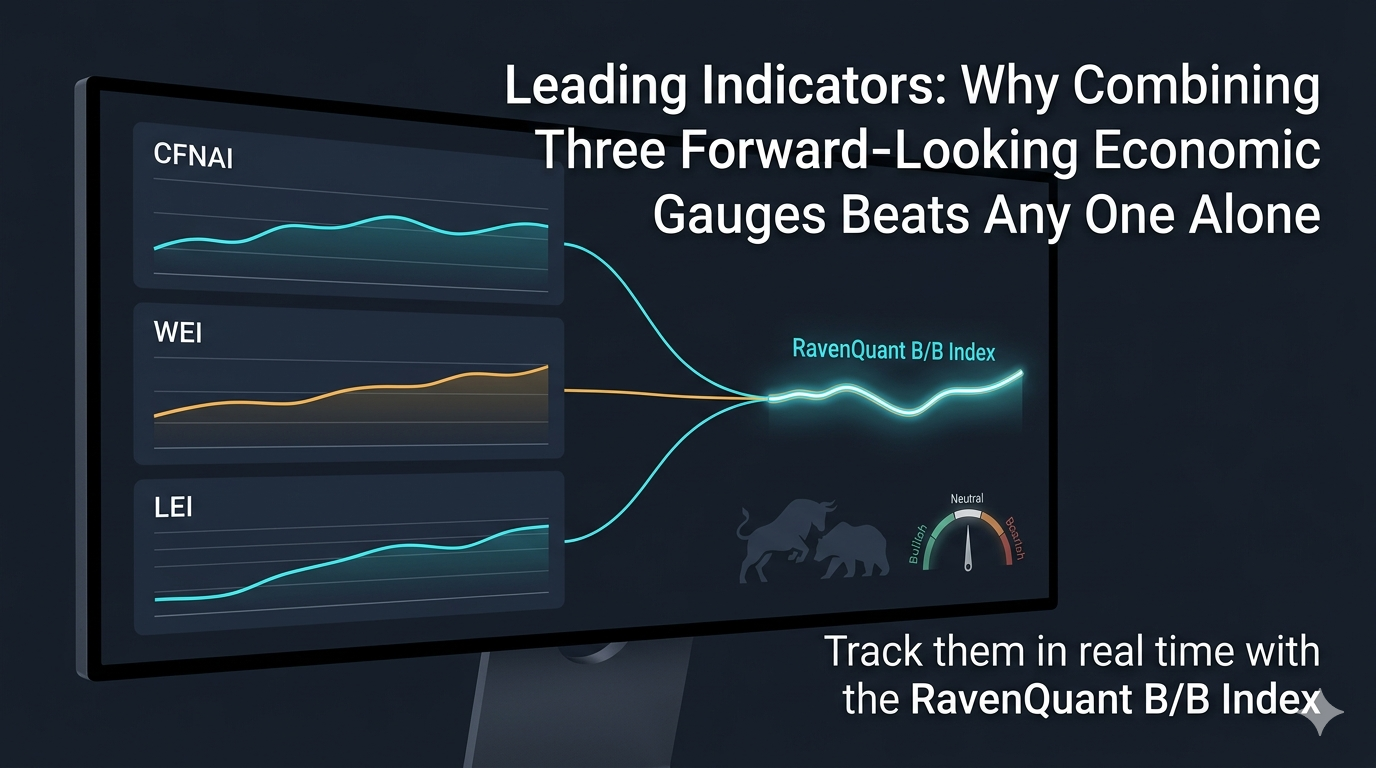
The three most practical forward-looking series for systematic macro work are the Chicago Fed National Activity Index (CFNAI), the Weekly Economic Index (WEI), and the Conference Board Leading Economic Index (USSLIND). Each has a different construction, a different update frequency, and a different set of blind spots. Understanding what each is measuring — and why they complement each other — is the foundation for using them well.
Why CFNAI, WEI, and OECD CLI Work Better Together
The Chicago Fed National Activity Index is the workhorse of the group. The Chicago Fed constructs it from 85 monthly economic indicators spanning production and income, employment, personal consumption, housing, and sales and orders data. It’s designed so that a reading of 0 corresponds to the historical trend growth rate for the US economy (roughly 3% real GDP annually), positive values indicate above-trend growth, and negative values indicate below-trend.
The recession-signaling threshold is well-established: a three-month moving average (CFNAI-MA3) below -0.70 following a period of expansion historically signals an increasing likelihood that a recession has begun. The Chicago Fed’s own analysis documents that this -0.70 threshold has correctly identified recession months with 86% accuracy since 1967. During the 2008–09 financial crisis, the CFNAI-MA3 plunged to some of its most negative readings ever recorded, matching the severity of what was unfolding in real time.
The CFNAI’s depth — 85 underlying series — is its great strength. It’s hard to game or distort, and it captures economic activity across dimensions that any single survey or report would miss. Its weakness is timing: monthly data means you’re always at least a few weeks behind, and revisions to underlying series can shift the CFNAI reading after the fact.
How to Read Divergences Before the Cycle Turns
The Weekly Economic Index was developed by researchers at the New York Fed and Yale, and is tracked on FRED as the WEI series (Lewis-Mertens-Stock). It aggregates 10 weekly economic indicators — including fuel sales, electricity output, railroad traffic, steel production, mortgage applications, and initial jobless claims — into a single index calibrated to correspond to annual GDP growth rates, making it directly comparable to quarterly GDP numbers.
The WEI’s value is speed. It updates weekly, which means it can catch inflection points weeks or months before monthly data reflects them. Its 2020 performance was a vivid demonstration: when lockdowns began in mid-March 2020, the WEI collapsed dramatically within days, capturing the sheer cliff-edge of the economic shutdown in near-real time. Monthly data like the CFNAI took another several weeks to confirm what the WEI was already screaming. For any framework that wants to be responsive to economic turning points, this weekly velocity matters.
The weakness is noise. Weekly economic data is inherently choppier than monthly averages, subject to weather, holidays, and one-off disruptions that have nothing to do with the business cycle. The WEI smooths some of this, but it’s a noisier signal than the CFNAI by construction.
Why the Conference Board LEI Adds Critical Breadth
The Conference Board Leading Economic Index for the US (USSLIND) brings yet another dimension. Published monthly by The Conference Board, it’s a composite of ten components that span financial markets, manufacturing, the consumer, and housing: building permits, manufacturers’ new orders for consumer goods, the ISM manufacturing new orders index, the interest rate spread, leading credit index, average weekly hours in manufacturing, initial jobless claims, consumer expectations for business conditions, and equity prices.
The breadth of these inputs is the point. When all ten components are deteriorating simultaneously, the signal is far stronger than when only three or four are negative. The Conference Board LEI has an established track record of rolling over before recessions — three consecutive monthly declines have historically been a reliable early warning. It’s updated with a lag relative to the reference month, but the composition across financial and real-economy variables gives it a robustness that more narrowly constructed indicators lack.
Why Combining Leading Indicators Improves Reliability
The case for using all three together rather than selecting the “best” single indicator is straightforward. The CFNAI provides depth (85 series, monthly resolution). The WEI provides speed (10 weekly series, updated every week). The USSLIND provides breadth across cyclical sectors. When all three are positive, it’s a confident signal of above-trend economic momentum. When all three are deteriorating, the bearish signal is much harder to dismiss than if only one series were declining.
Real-time macro analysis comes with a permanent caveat about data revisions. The initial print of the CFNAI can look quite different from the revised figure released months later. In 2008, for example, several months of economic data looked less bad in real-time than they did after revision. Operating on preliminary data is unavoidable — it’s the nature of economic measurement — but combining three independent series reduces the risk that any one data release, or any one revision cycle, drives a misleading regime call.
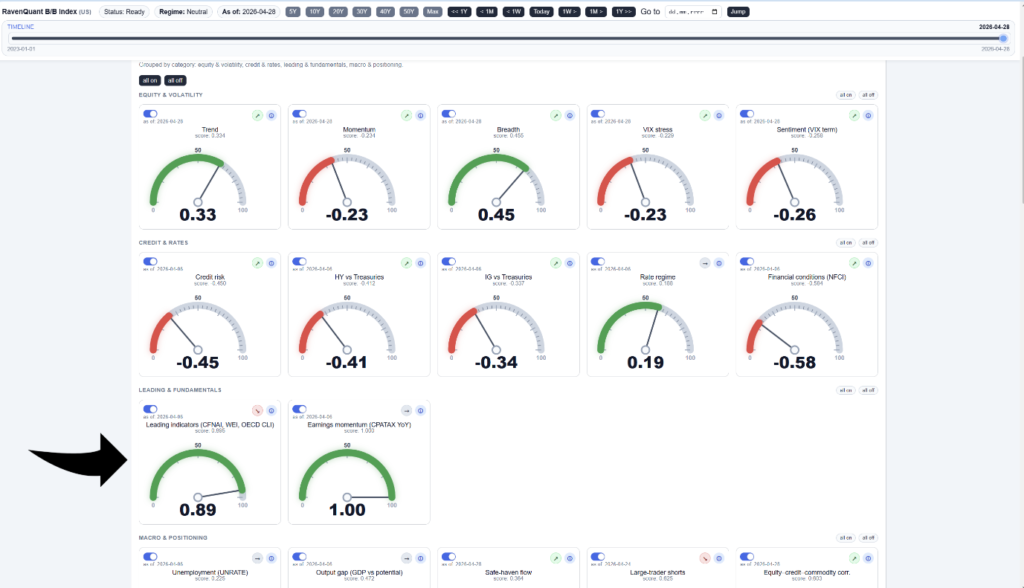
Track Leading Indicators in RavenQuant in Real Time
If you want to track the combined leading indicators reading in one place — rather than pulling the CFNAI from the Chicago Fed, the WEI from FRED, and the USSLIND from The Conference Board separately — it’s one of the factors tracked in the RavenQuant B/B Index at ravenquant.com, with a 20-day trend direction that’s particularly useful around economic turning points where the direction of change matters as much as the absolute level.
Explore the live index here: https://bull-bear-analyzer-production.up.railway.app